Note: Posts on this site are for education purposes only. They provide one firm’s insight on the markets. Not investment advice. See additional disclaimer here.
From a strategic standpoint, this past Friday was the end of the Quarter and possibly the lowest risk spot to short the semis (not advice, not a recommendation).
‘Low risk’, does not mean, ‘no risk’.
We’ll look at the chart below for the SOXX, but first some housekeeping on the Junior Miners, GDXJ.
As stated in the last update, if there was more GDXJ, upside, shorts (via JDST) would be exited. That’s what happened with an overall gain of + 3.57%, on the series (beginning 6/16/23).
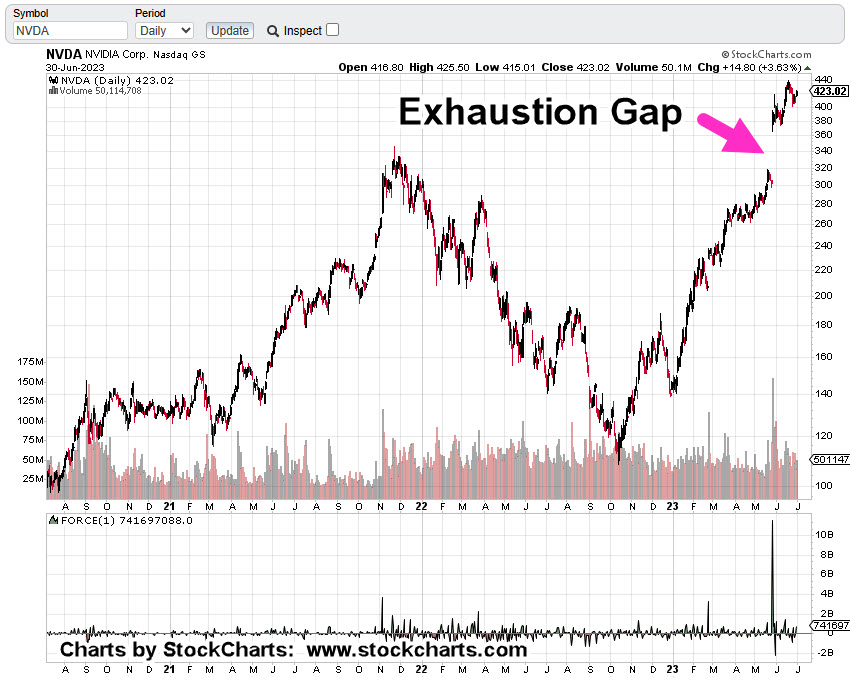
Now, on to the next circus … Artificial Intelligence; more specifically, NVDA and its cohort, the SOXX.
Where’s The Money?
With the quarter over, money managers have dutifully shown they’re like everyone else, ‘investing’ in AI.
That’s out of the way, so let’s move on to the specifics:
Referring back to the excellent investigation done by The Maverick, in his view, the $11 Billion, is “Fantasy”.
The tricky part from a chart standpoint, is to identify when or if that fantasy is going to be exposed.
Semiconductor SOXX, Weekly (Inverted)
We’ve taken the weekly chart of SOXX, and inverted it as if going long the leveraged inverse SOXS (not advice, not a recommendation).
Downside force dissipating with each major thrust.
Last week was an ‘inside week’; price action could not make a new weekly low.
Couple that with end of quarter, potential ‘window dressing’ and this past Friday, may have been the lowest risk point, for shorting via SOXS (not advice, not a recommendation).
Analysis … not Advice
This site cannot and will not give advice.
What it can do, is provide analysis and strategy so that you can make your own determination on the market.
With that said, the ‘heads-up’ for a top in the SOXX, was posted on June 17th, link here.
Since that time, the SOXX reversed down and has now come back to test.
Positioning
On Friday, the SOXX, was shorted by entering long the inverse fund SOXS, at 10.01.
Soft stop (trader discretion) for the position is the session low at 9.75, and hard stop (no excuses exit) at all-time low of 9.48 (not advice, not a recommendation).
The coming weeks may prove interesting. All eyes will be on that ‘$11-Billion’.
Note: Posts on this site are for education purposes only. They provide one firm’s insight on the markets. Not investment advice. See additional disclaimer here.
Beginning at time stamp 6:24, at this link, The Maverick goes through an investigation into NVDA, projections.
‘Something doesn’t add up here ….’
That report was three weeks ago. What’s happened, lately?
As of the close this past Friday, NVDA, the largest in the SOXX, was at $1.1-Trillion, market cap. A distant second, is Taiwan Semi (TSM) at $545.5-Bln.
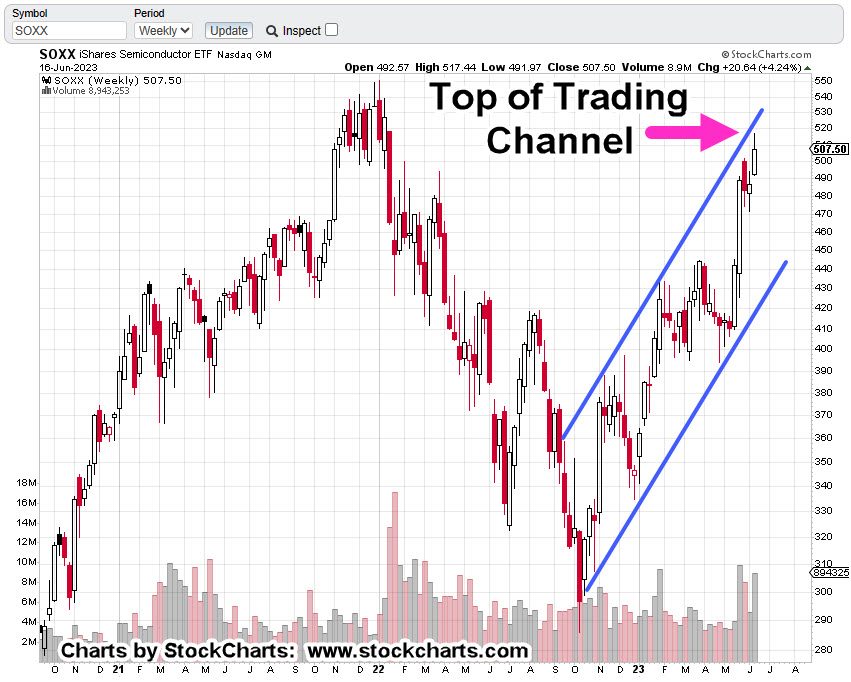
Below, we have a confluence of events for the SOXX.
Semiconductor (ETF), SOXX, Weekly Candle
We’re at the top of a trading channel.
We’re in Wyckoff ‘Up-Thrust’ (reversal) position.
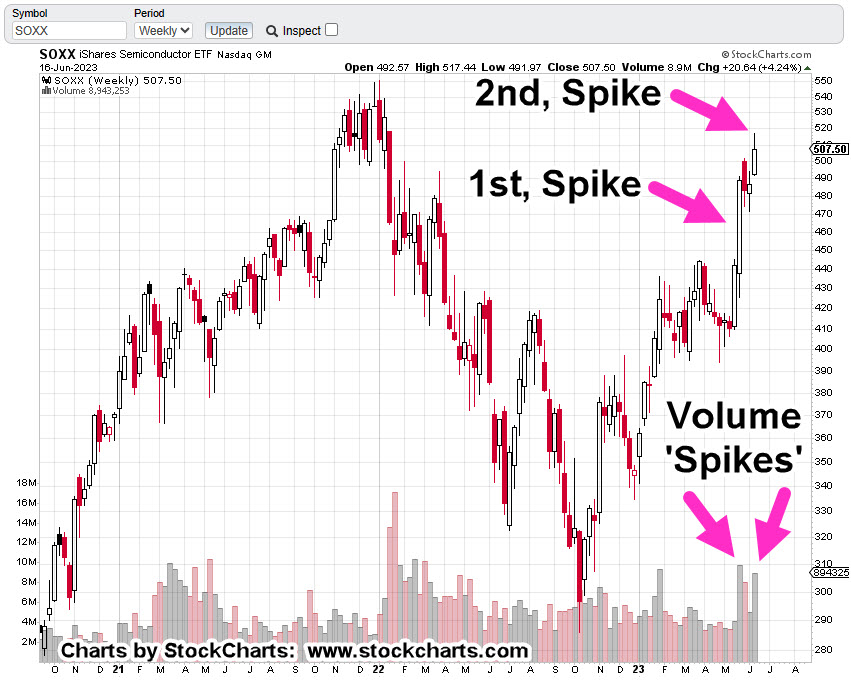
A lot of volume expended with less (net) upward progress than previous volume spike; ‘effort vs. reward’.
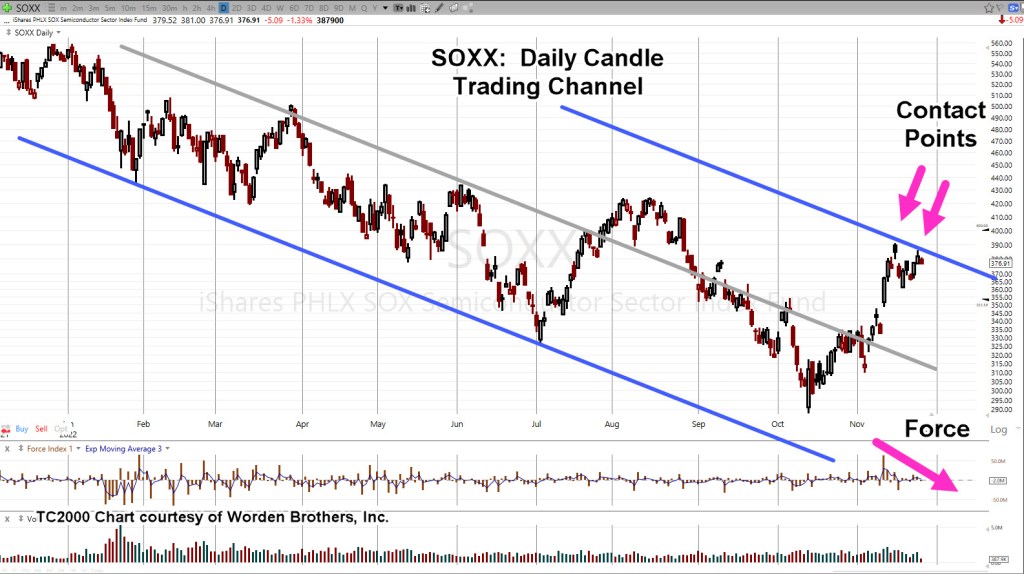
Getting down to the daily, we see a terminating wedge that’s coupled with reduced volume.
Semiconductor Index SOXX, Daily Candle
So, what does that mean?
The ‘probabilities’ for more upside are, or have been, reduced significantly (not advice, not a recommendation).
Note: Posts on this site are for education purposes only. They provide one firm’s insight on the markets. Not investment advice. See additional disclaimer here.
The majority of the indices are at their right-side channel lines.
We’ll cover semiconductor SOXX, and QQQs, below. However, biotech IBB, and SPBIO, are in similar positions.
From a calendar and data standpoint, there’ll be plenty that could be used as an ‘excuse’ for market moves but let’s ignore the (intended) distractions and take a look at what the market is saying about itself.
First up, is the semiconductor index, the SOXX.
Semiconductor’s, SOXX, Daily
The chart has Fibonacci retrace levels shown. Price action has retraced to 38.2% and stalled.
But wait, there’s more.
Putting in a trading channel, we could be at a reversal point.
Note the upward thrust energy (‘Force’) has dissipated.
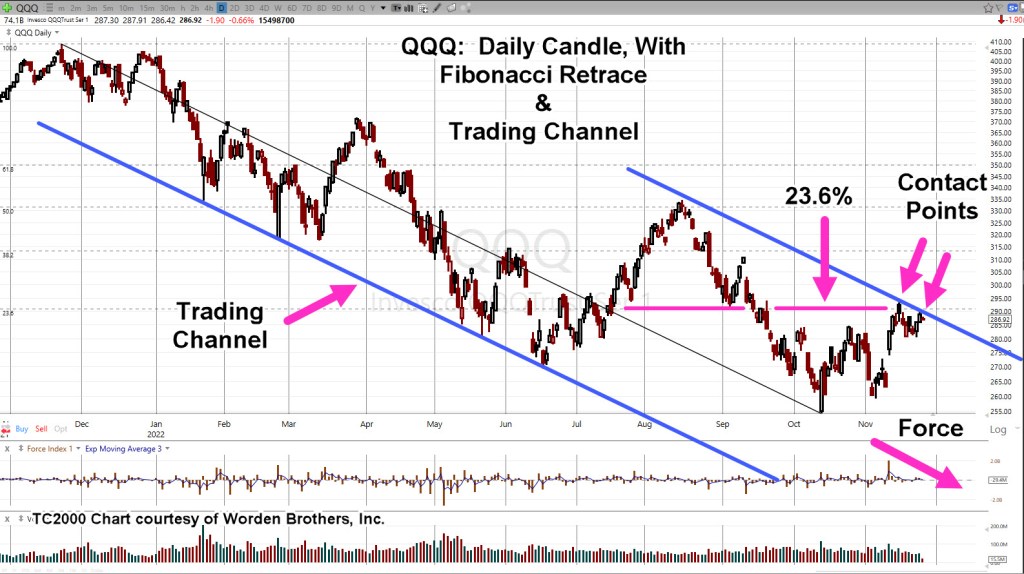
the NASDAQ is in a similar situation but weaker from a retrace standpoint.
NASDAQ, QQQ, Daily
Looking at the monthly chart for the Q’s (not shown), it’s been a Fibonacci 13-months since all-time highs.
Force dissipation and ‘Contact Points’ are near identical to the SOXX.
Summary
Biotech IBB and SPBIO, are in similar positions. In fact, the overall markets appear poised for downside reversal.
As discussed in the last update, the bond market could be signaling danger ahead with its sharp upward reversal; now (potentially) entering its sixth week.
Note: Posts on this site are for education purposes only. They provide one firm’s insight on the markets. Not investment advice. See additional disclaimer here.