Big Money, Big Move

The big money is in the big move. 

One recent example; the bond move from late 2018, to early 2020.

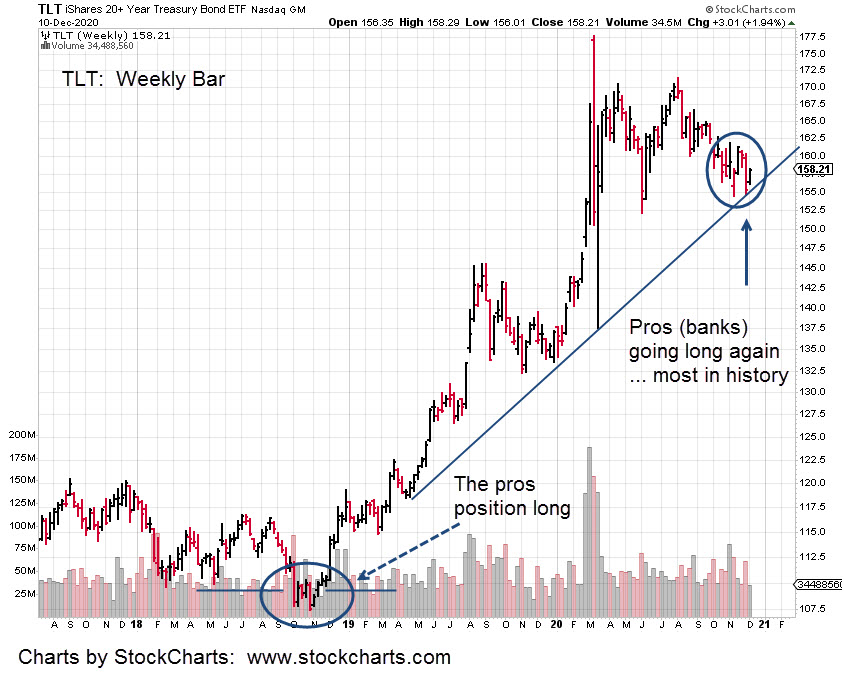
During the low from October 2018 to November that year, were reports of professionals opening huge long positions. 

At the time and as the weeks went by, it appeared that nothing was happening. 

The delay would have caused the typical i-phone addicted ‘tweeter’ to lose interest many times over.

When it finally took off, bonds staged a huge directional move that lasted over a year.

Such moves are rare and require the ability to wait. Wait to get in and wait for the move; minimize transactions.

Each market transaction is an opportunity for error.  Minimize the transactions and by definition, the errors are minimized as well.

That brings us to oil and more specifically, XOP and DUG.

The nonsense being promulgated by the financial press is that oil is moving higher on ‘hopes’ for an economic recovery.

Maybe injecting the world-wide population with potentially DNA altering technology (not even tested on animals first) for an ailment that does not exist will miraculously launch some kind of pent up consumer demand.

No matter. Oil and its attendants keep moving higher with the dollar moving lower.

Even with anecdotal evidence from an Oklahoma oil field worker (commenting on a Van Metre update) that was later confirmed by the EIA report did not cause oil to move lower … yet.

That is, until today.

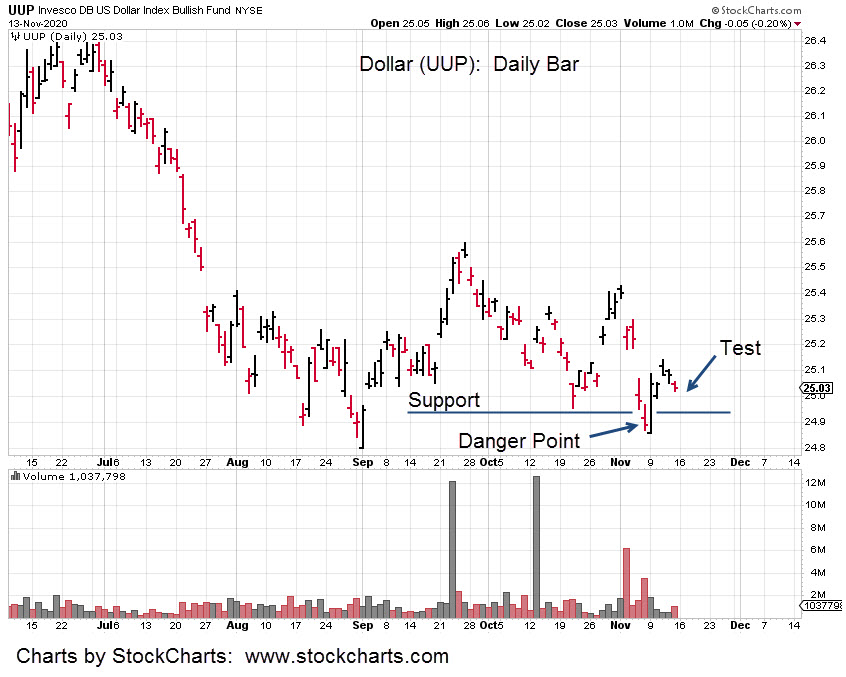
The dollar attempted to continue its downtrend yesterday.  Oil spiked as did XOP to the upside and DUG to the downside.

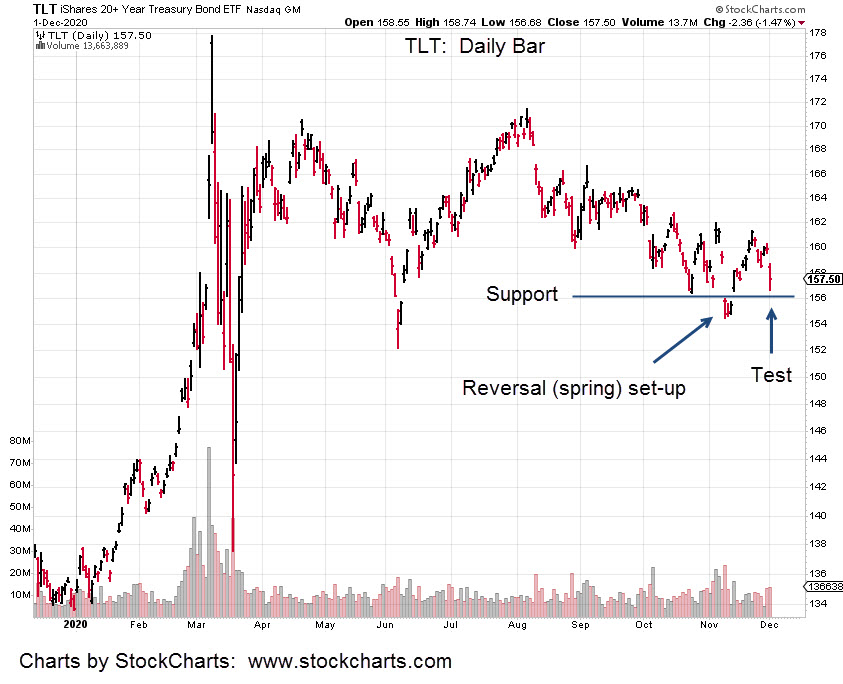
This morning is a different story.  Dollar proxy, UUP is trading (pre-market) right at its highs of the last session in an apparent reversal. 

Oil along with XOP is down, with DUG up.

Looking at XOP, we see it’s hitting a long-established trend line. 

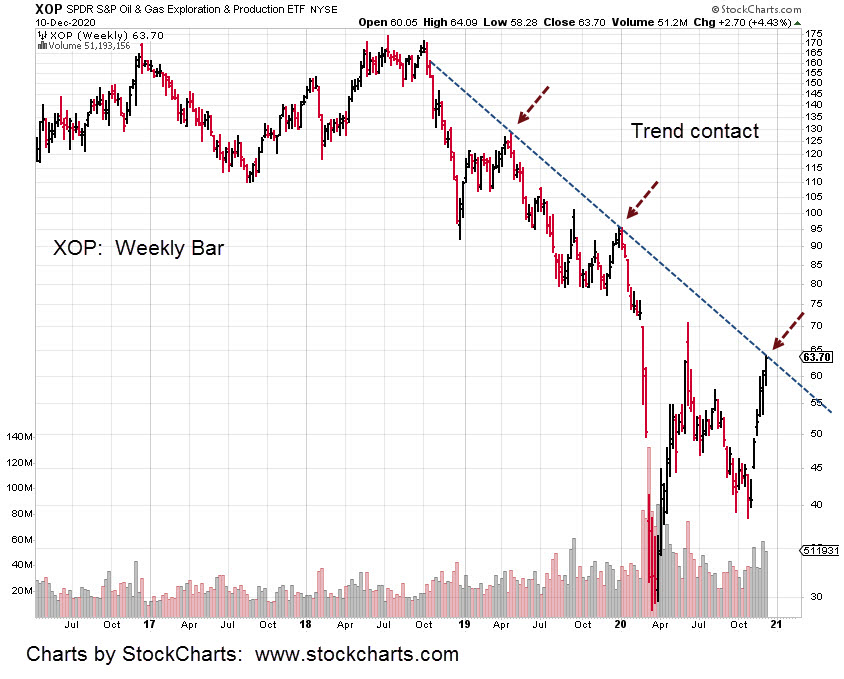
With the dollar, bond, and overall market extremes, no recovery in sight and more probable, another (and complete) collapse; this may be the spot (not advice, not a recommendation) to position for medium to long term on the short side.

That’s exactly what the firm has done.  Looks like our position was a day too early as we sat through yesterday’ spike lower in DUG.

Volume remained heavy for that DUG session. Weekly volume is looking to be the largest (big-money moving in) since at least 2015.

Stay Tuned

Charts by StockCharts

Note:  Posts on this site are for education purposes only.  They provide one firm’s insight on the markets.  Not investment advice.  See additional disclaimer here.

Bond Test

Bonds (TLT) were hit hard during the last session.  Are higher rates ahead?

The short answer is no … if the test shown in the TLT chart holds.

What we have is typical market action at a significant reversal. 

Putting it in perspective, the push below support (blue line) lasted a full three days before reversing higher.

Then we have twelve days of upward recovery until yesterday.  Price action was slammed -1.57%.

It might look like we’re headed back to lower bond prices and higher rates; in effect, what we really have is a test of the reversal.

You can almost feel it. A major event is near.

The equity markets at all time highs … extremes of ‘retail’ participation never seen before. 

Couple that with the largest-ever short position in the bond market (about to get squeezed). 

The dollar’s at the bottom of its trading range … gold already heading lower.

The sense is a major market reversal is very near.  It’s probably already happening but just not obvious enough … yet.

We’re not going long the bond market but rather going short other markets.

Most of the short position in DUST was exited during the last session when price action came back to the intra day highs.  The potential squeeze got a reprieve at least for the day.

It’s important to note, yesterday’s GDX move went to a near exact Fibonacci retrace of 23.6%.  The down-trend could proceed at any time.

Separately, a short was entered in the biotech sector via BIS (not advice, not a recommendation).

Pre-market activity (as of 9:02 a.m. EST) for IBB indicates a lower open with BIS correspondingly higher.

Charts by StockCharts

Note:  Posts on this site are for education purposes only.  They provide one firm’s insight on the markets.  Not investment advice.  See additional disclaimer here.

Testing: 1, 2, 3

The dollar has reversed and is now testing the lows. 

Conversely, when we look at the price action of gold (GLD) its collapse exactly mimics the dollar’s reversal.

Taking into account the futures market activity in gold, it made new daily highs last week during the overnight session, Sunday-to-Monday. 

Using that knowledge on GLD, (adding it to price action) it retraced to 38%, of the recent down move this past Friday.

If we’re in a real bona fide reversal of the dollar and gold (posting more confirmation on gold tomorrow), then expectations are for continued gold downside during the coming week.

The dollar, bonds and gold, at this juncture are moving in tandem:  Dollar and bonds up, gold (and silver) down.

Charts by StockCharts

Note:  Posts on this site are for education purposes only.  They provide one firm’s insight on the markets.  Not investment advice.  See additional disclaimer here.

Bond Reversal

In the past three days, bonds (TLT) penetrated support and stopped dead.

Anytime a market penetrates support or resistance and halts, it’s an indication that something’s up.

Either the market‘s absorbing transactions at that level to continue on, or it’s a reversal about to happen.

With all that’s known on the short position by the speculators as well as another Van Metre report, bank lending standards, probabilities point toward bond reversal.

The dollar is already reversing higher.  Gold has been viciously slammed lower and the overall market’s hovering at all time highs.

The Dow edged lower at the last session. This session in the pre-market (9:01 a.m., EST) it’s lower again at -1.94 points or -0.66%.

If the Dow (DIA) gets below the 290- area, it’s below resistance and another move higher may be difficult indeed.

We’re short the sector via DXD (not advice, not a recommendation). A new daily low for DIA will allow our position’s stop to be moved to DXD 13.49.

Charts by StockCharts

Note:  Posts on this site are for education purposes only.  They provide one firm’s insight on the markets.  Not investment advice.  See additional disclaimer here.

Gold Watch

The overnight session was active for gold.  The GCZ20, December futures contract traded between a high of 1,917.90, and a low of 1881.80, a 36-point range, nearly 2%.

Gold is now off the lows and testing its overnight highs.

From a regular session standpoint, we’ll be watching the 179.43, GLD level covered in the last update.

If that high is penetrated it does not mean that gold will continue on higher immediately. 

It would mean that probability is now about even to greater, higher prices are ahead.

From the Junior Mining index, the GDXJ standpoint, there’s a Fibonacci level located at approximately 56.80.

Looking at the big picture, the short squeeze in bonds looks like it’s getting underway in earnest.    

There was just one more downward thrust that was not able to penetrate the TLT, 156.75 lows from the week of October 19th

The overnight move higher in bonds was a serious hit to the shorts. It’s now time to see if this move feeds on itself … higher.

These dynamics, the dollar, gold, interest rates, the four-standard-deviation-short in bonds are all operating simultaneously.

We’re sitting in the background and quietly observing everything. 

The choice at this point (not advice, not a recommendation) is to sneak into a significant short position on the Junior Miner index, GDXJ (via JDST).

We’ll see how it works out.  Obviously GLD and the 179.43 high, is being watched closely.

Note:  Posts on this site are for education purposes only.  They provide one firm’s insight on the markets.  Not investment advice.  See additional disclaimer here.

The Squeeze Is On

Pre market activity (8:31 a.m. EST) has TLT trading up +0.74, at 161.29, which is above the target level set in the last update.

We’ve already laid the groundwork for the ‘speculator’s’ short position in bonds as the largest in history.

It’s the ‘commercials’ that know their markets and in this case (according to Steven Van Metre), the commercials are the banks.

Isn’t it interesting. The banks always get their money, right?

Well, that may be about to happen now, as well.

Just a quick digression from today’s update and concerning the Van Metre link above. At time stamp 14:29, he shows a Wyckoff accumulation schematic. Nice.

From a trading standpoint, there are leveraged bond funds such as TMF (not advice, not a recommendation).

However, this firm has never traded that vehicle and is choosing to be short the junior gold miners (JDST) as well as long natural gas (UNG) for its current positioning.

Natural gas (UNG) for a seasonal trade … with some potential supply disruptions thrown in; the Junior Gold Miner short position (JDST) to work the ‘deflation’ side of what’s going on.

Reports here and here, provide documentation on the thinking behind those positions.  Searching for UNG and JDST will give the full gamut of research.

Back to the markets. If we’re doing our job right and there’s a huge down-draft, we’ll already be in position to profit as a matter of course.

Note:  Posts on this site are for education purposes only.  They provide one firm’s insight on the markets.  Not investment advice.  See additional disclaimer here.

Long Bond Short: Largest, Ever

Charts by StockCharts

Note:  Posts on this site are for education purposes only.  They provide one firm’s insight on the markets.  Not investment advice.  See additional disclaimer here.