Let’s go back to the last update on Tesla (TSLA), and see how that analysis is working out:
“Unless we reverse right here and now, Fibonacci retrace and projections (shown below) target the $260 – level for TSLA.”
That was back in early March.
Now, TLSA is currently trading (as of 11:30 a.m., EST) at 246.71, and pushing higher.
The original chart of TSLA, from the March 5th, update is below, followed by current activity.
Tesla TSLA, Daily
Original analysis.
Updated chart (11:15 a.m., EST):
From a trading perspective, TSLA, is being used as a proxy for the market.
That means, if there’s to be a reversal at or near the 259-area, it’s likely the overall market will reverse as well (not advice, not a recommendation).
The ‘Ponzi’ has already been established (the last update). We see the delusion continues with reports like this.
Note: Posts on this site are for education purposes only. They provide one firm’s insight on the markets. Not investment advice. See additional disclaimer here.
The ‘Artificial Intelligence’ (AI) clown show’s in full swing with a ‘predicted‘ single quarter target of $11-Billion, from NVDA.
That’s not to be confused with the budget clown show just ended in Washinton D.C.
And where does that leave Tesla? They seem to be left out of the latest round of cult-like insanity.
Back in the day, Dr. Alexander Elder stated, professionals don’t look for the ‘challenge’ in the markets (trying to figure out the NVDA, top), they look for the ‘money’ … there’s a huge difference.
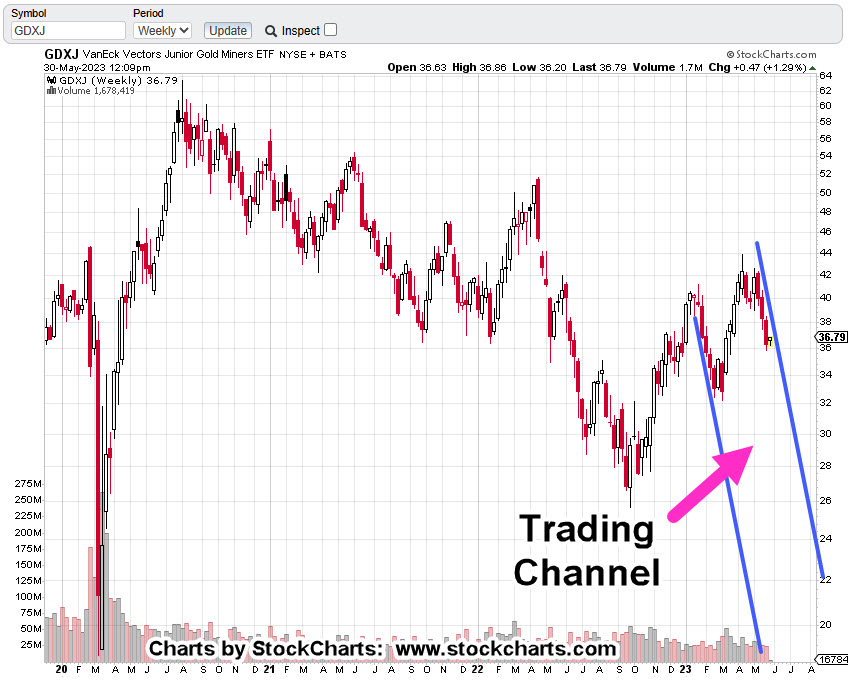
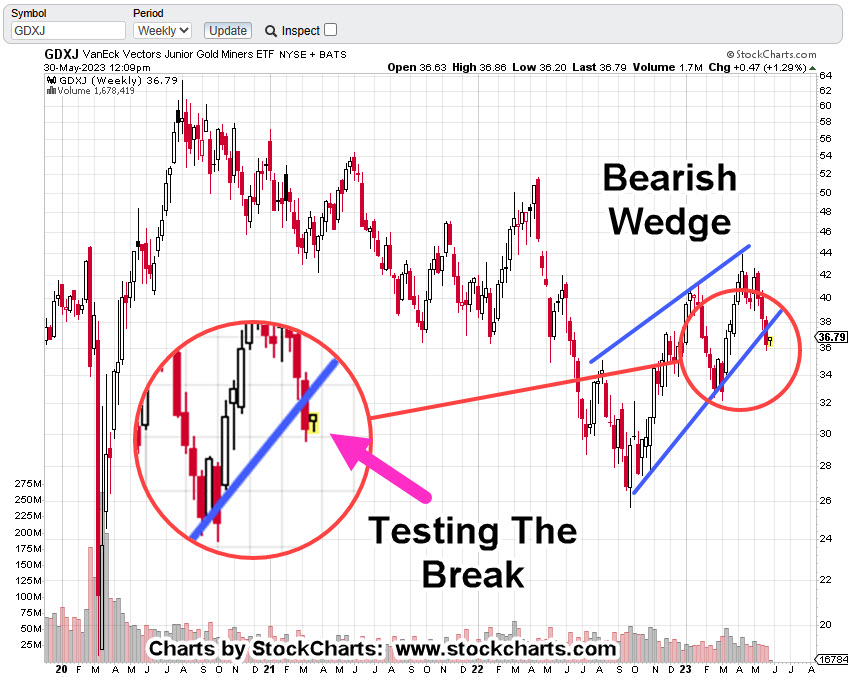
Junior Miners GDXJ, Weekly Candle
As of 12:35 p.m., EST, from a technical perspective, even though we’re up for the day (so far), MACD momentum’s increasing to the downside (magenta arrow).
Nobody seems to be paying attention to gold and silver; all eyes are focused on the next shiny object.
Pulling out a bit farther on the weekly, there’s no question we’re in a channel.
The question is, are we (GDXJ) going to say in that channel or reverse from here?
The last update said we’d likely be testing the wedge break and that’s what’s happening.
A ‘test’ will take however long is needed. It’s either pass or fail. Pass in this case is resumption to the downside.
Technical conditions (MACD, wedge break) favor the downside (not advice, not a recommendation).
In addition, we need to keep in mind there’s a new circus in town; the miners may be well on their way to more downside before anyone steps out of the big-top to notice.
Note: Posts on this site are for education purposes only. They provide one firm’s insight on the markets. Not investment advice. See additional disclaimer here.
Unless we reverse right here and now, Fibonacci retrace and projections (shown below) target the $260 – level for TSLA.
If you know what’s (potentially) coming, you can get ready.
The ‘Ponzi’ case for Tesla has already been established with this prior link, here. Of special note in that link, are the production percentages for General Motors.
With all of that, let’s go out on a limb and project TSLA might top at 266, instead of the Fibonacci projected 260 (not advice, not a recommendation).
Tesla TSLA, Daily
The daily chart is compressed to show the entire down-wave and retrace from the November 4th, 2021, high.
Three retrace levels are shown (magenta); first is 23.6%, then 38.2% and labeled retrace of 50%, near the 259-level.
Moving closer-in, and including Fibonacci wave projection, while keeping the retrace levels, yields the following.
The chart’s a little bit busy but one gets the idea.
There’s a Fibonacci overlap of retrace and projection near the 259-260, level.
What’s another 6-points between friends to get to 266?
Next Steps
Of course, anything can happen and TSLA, could reverse to the downside on Monday.
However, if it continues higher, we’ll be monitoring for potential confirmation of the target and subsequent reversal (not advice, not a recommendation).
Note: Posts on this site are for education purposes only. They provide one firm’s insight on the markets. Not investment advice. See additional disclaimer here.
Note: Posts on this site are for education purposes only. They provide one firm’s insight on the markets. Not investment advice. See additional disclaimer here.
Its current market capitalization is over ten-times that of General Motors (GM); a company that’s been in business, since 1908.
GM’s auto production numbers for 2022, were 66% higher (imagine that), than Tesla’s 1.37-million; provided, that we actually believe any of the data. 🙂
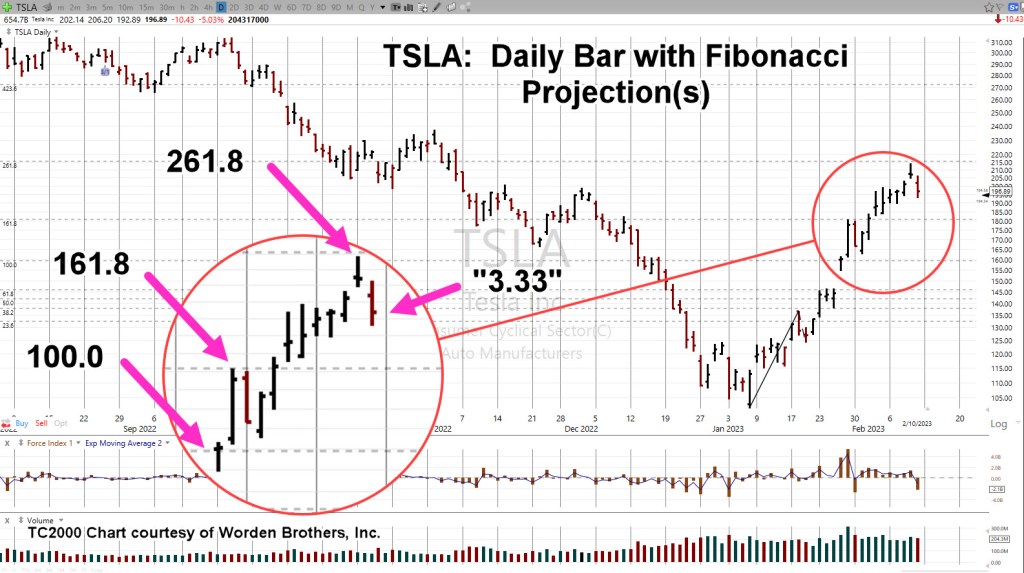
If we take Tesla’s market cap as of Friday’s close (654.7bln) and divide it by the closing price of 196.89, we get 3.33.
You can’t make this stuff up.
The TSLA market has ultra-high liquidity and is highly emotional (like the gold market). That liquidity lends itself to Fibonacci-based analysis.
We’ll get to the analysis but first, the options trade.
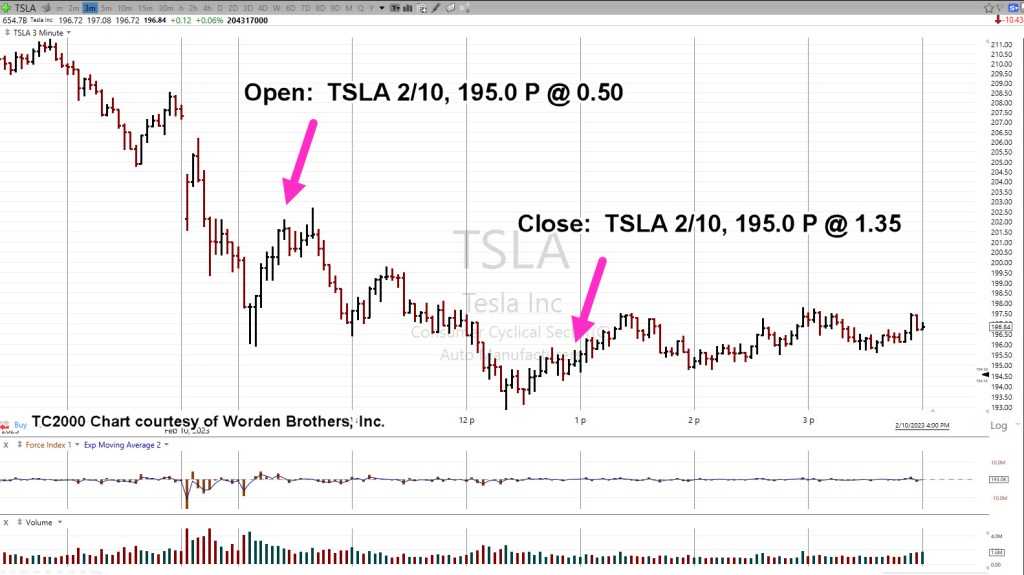
Tesla TSLA, Option Trade: 3-minute Chart
We’re trading the day of expiration 2/10, and the value is decaying rapidly. The entry of 0.50 was about where the option closed on the prior session.
Note, the entry was made on the way up … extremely difficult to stomach selling short, on an expiring position, as the price is rising.
Option was closed when it was obvious there was no more downside for the day. Since it was a 195.0 Put, it expired worthless at the end of the session.
Now, on to Fibonacci.
Tesla TSLA, Daily, with Fibonacci Projection(s)
The chart shows how precise the moves have conformed to Fibonacci.
We’ve included the “3.33”, as mentioned above; it will be interesting to see what happens at the next open.
After-hours activity was down – 2.31 pts, on 2,486,196 shares, according to BigCharts.
Depending on subsequent price action, the next update will address the Fibonacci downside projections.
Note: Posts on this site are for education purposes only. They provide one firm’s insight on the markets. Not investment advice. See additional disclaimer here.
Note: Posts on this site are for education purposes only. They provide one firm’s insight on the markets. Not investment advice. See additional disclaimer here.
In fact, Wyckoff’s stock market training course, first published in 1934, (still available), says that until you can ignore the financial press completely, ‘You will never be successful in the markets’.
Price action itself, properly interpreted, will tell you where to look for the opportunity.
The Ponzi Implosion, Cometh
The market is littered with Ponzi schemes. Some have already imploded, CVNA, HOOD, Crypto; some have not.
Concerning Crypto, here’s an excellent update from Michael Cowan. Buried in that update, at time stamp 4:58, looks like HOOD, may be in even more trouble.
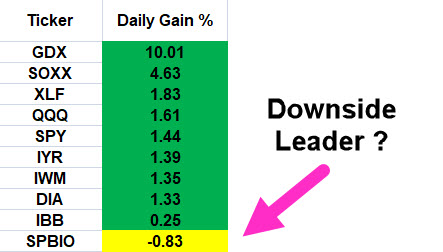
Biotech is in a class of its own and was discussed in yesterday’s update.
For gold, we’re going to look at the Junior Miners GDXJ, and last week’s action.
Junior Miners GDXJ, Daily Close
The Junior’s are the weakest in the sector; therefore, that’s where we look for a short opportunity (not advice, not a recommendation).
To move higher, above resistance, normal market behavior, is to come back to the lower blue line (i.e., support) to gain enough energy to move higher for a breakout.
To move lower, normal market behavior, is to come down to the lower blue line as a test which subsequently fails; the move continues lower.
Either way, normal behavior at this juncture, is to move lower. We’ll see.
Now on to the chief cook and bottle washer … Tesla.
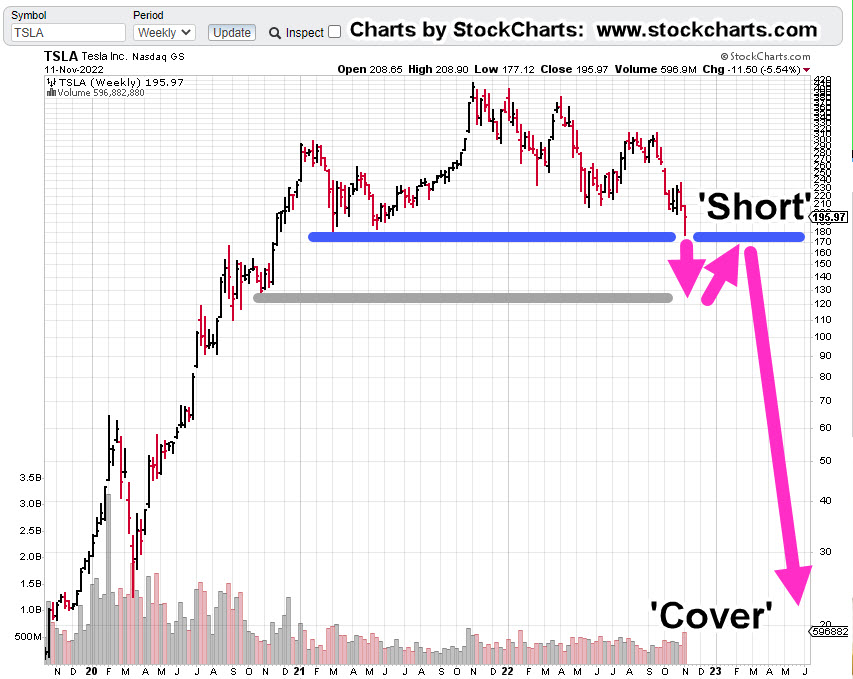
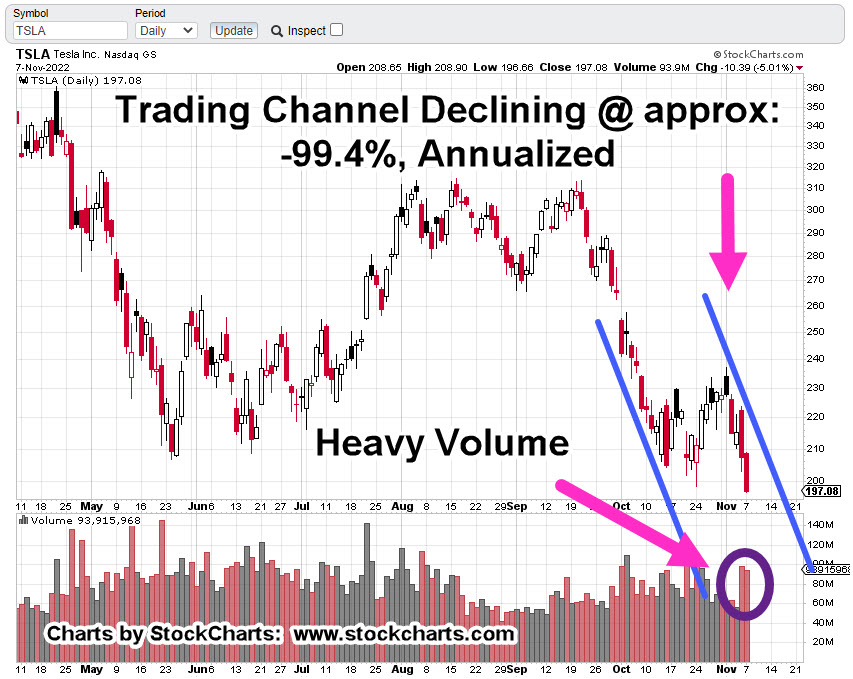
Tesla (TSLA), At The Edge
For starters, let’s recognize there’re a lot of moving parts; U.S. ‘parts’ and China ‘parts’.
If one’s going short, another task is to forecast under what conditions a short would have enough risk removed.
For that answer, oddly enough, we go to gold, GLD.
Gold GLD, Weekly: 2015 – 2017
GLD posted a massive upthrust above the blue line lasting over fourteen weeks before breaking decisively lower.
Then, it labored four weeks to come back up for a test.
After that, collapse; lower weekly closes for seven consecutive weeks.
In the chart above, the area identified as ‘Short’, has as much upside risk removed as possible, right at resistance.
Now on to Tesla.
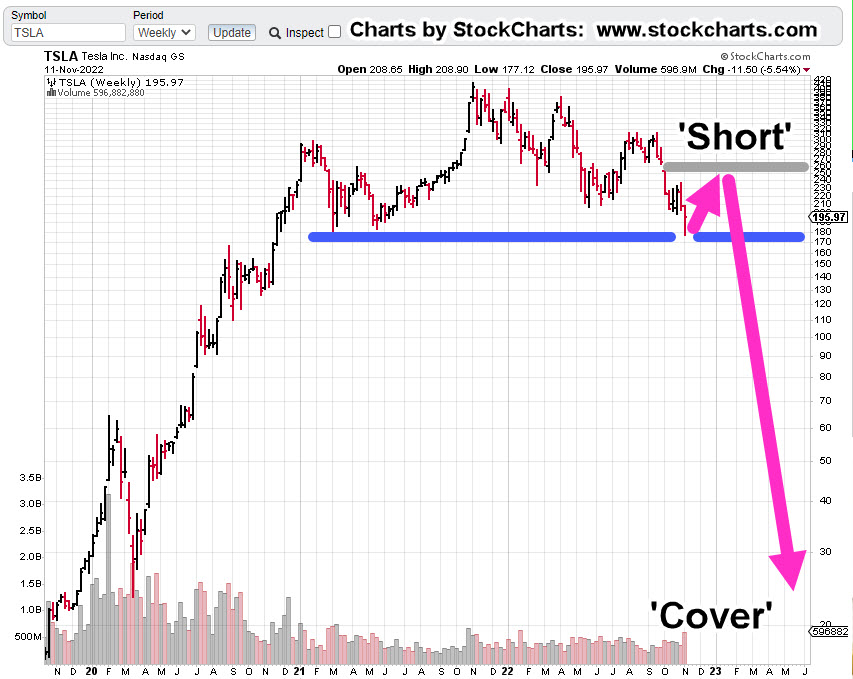
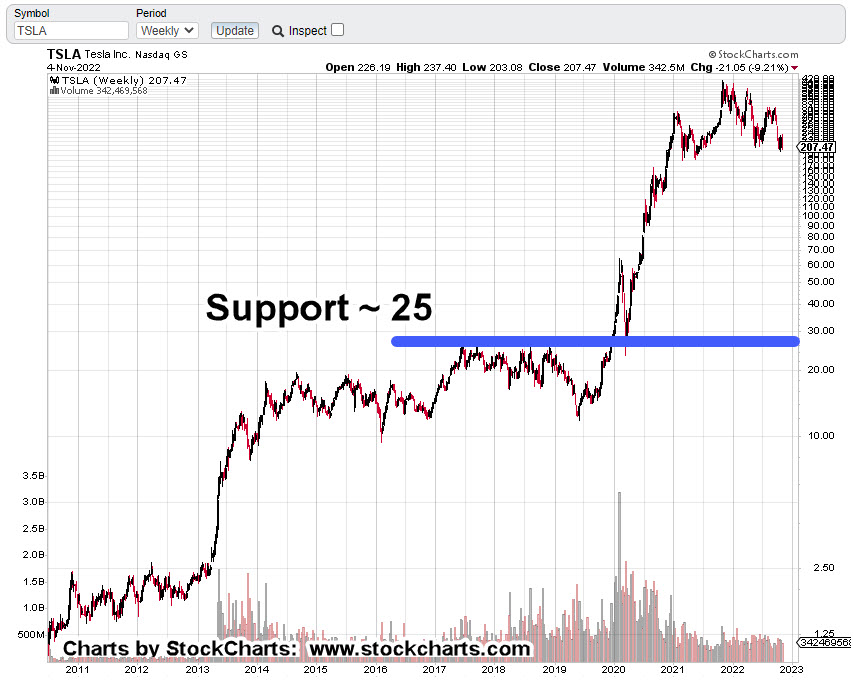
Tesla TLSA, Weekly
Two scenarios are presented where risk may be reduced.
Chart 1
Chart 2
One of these may happen or neither of them.
Either way, for risk to be reduced, a short entry is needed to be at a known resistance level (not advice, not a recommendation).
Let’s move on to the current positioning.
Positions: (courtesy only, not advice).
One of three events will happen at the next session.
1: Both positions stopped out
2: One position stopped out
3: No positions stopped out
Each outcome will provide a data-point where to focus (or not) in the current environment.
LABD-22-10:
Entry @ 18.1398: Stop @ 16.83
JDST-22-05
Entry @ 9.1666: Stop @ 8.79
Note: Positions may be increased, decreased, entered, or exited at any time.
Note: Posts on this site are for education purposes only. They provide one firm’s insight on the markets. Not investment advice. See additional disclaimer here.
Note: Posts on this site are for education purposes only. They provide one firm’s insight on the markets. Not investment advice. See additional disclaimer here.
There’re a lot of moving parts to biotech and it’s like a game of chicken.
Is there going to be another ‘planned’ event pulled out of the bag that requires ‘protection’ or will this side (and this one) win-out before that happens?
Price action’s always the final arbiter and right now, it’s positing lower.
Gold:
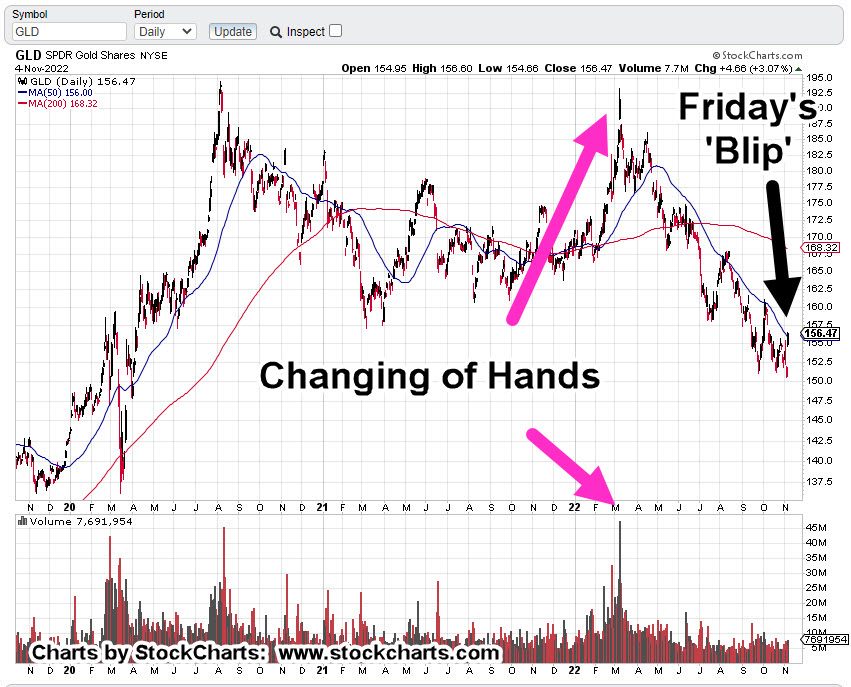
Gold (GLD) ‘blipped’ higher on Friday and the usual suspects are out touting the hyperinflation narrative.
Owning (some) precious metals seems to be a good thing.
However, the public constantly knee-jerks into this sector and is absolutely rabid in their behavior (i.e., silver stockpiles are running out!!!).
It suggests at least, there’s something else afoot.
Prechter published in the early 2000’s, Central Banks, are followers, not leaders. The fact they are buying gold at this point, may be a contrary indicator.
Talk about going against the herd. 🙂
Over and again, it’s the boring (does not generate ‘clicks’) food supply first, then gold and silver (not advice, not a recommendation).
Real Estate:
What can be said?
It’s the largest manufactured bubble in world history and it has already popped.
Thinking it’s all going to sort itself out in a year or two is delusional. We’ve probably got decades of bear market.
Tesla:
Anyone with an anode of research capability, knows the whole EV premise, is based on a falsehood.
However, that fact is probably not what’s going to bring Tesla (and the rest of the market) down.
Let’s stop for a moment and consider the above link which has been available for nearly four-years.
How many views? Just 9,824 (as of this post)
That equates to only 0.003% of the U.S. population.
As the global supply chains implode, getting parts and having stable infrastructure (i.e., electricity) will probably be the defining factor.
Now, on to the charts.
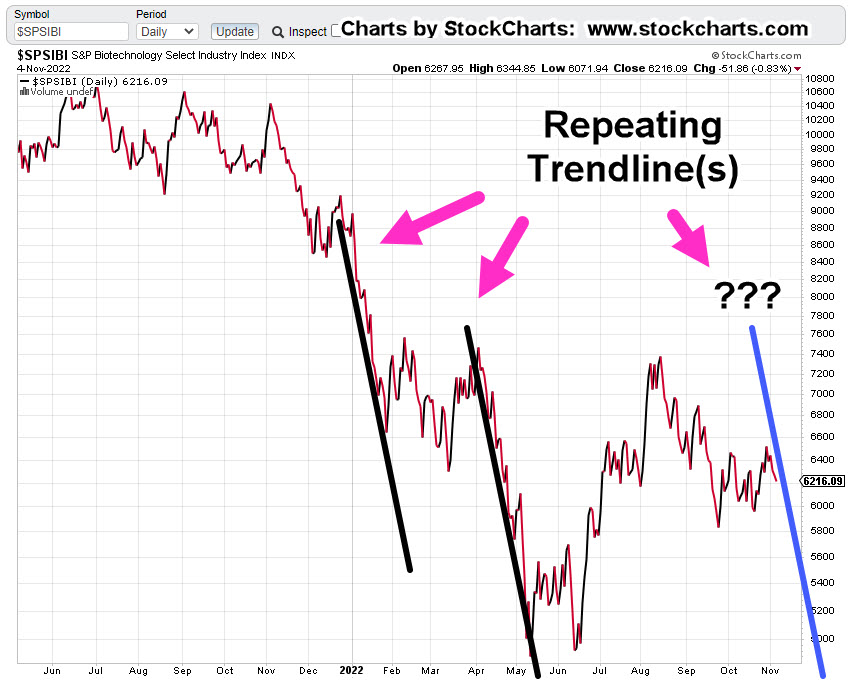
Biotech SPBIO, Daily Close
The following sessions will let us know if we’re at the right edge of the downtrend line.
We’ve already had an up-thrust reversal and a test of that reversal. last Friday was lower … probabilities point down.
Gold GLD, Daily
Looking at the chart on the strategic, longer term, Friday’s blip is hardly noticeable. We’ve already presented how this could be a minor up-thrust (reversal) in itself.
To keep the upside intact, price action must remain and continue above current levels.
Real Estate IYR, Daily
Real estate may be working its way into an up-thrust condition. As shown, Fibonacci Day 21 from the October 13th, low is this coming Thursday, the 10th.
According to the Economic Calendar there are several potential catalysts that may push the price above resistance (temporarily).
Note: Posts on this site are for education purposes only. They provide one firm’s insight on the markets. Not investment advice. See additional disclaimer here.
Note: Posts on this site are for education purposes only. They provide one firm’s insight on the markets. Not investment advice. See additional disclaimer here.