Who’s Left, To Cover?

Short interest on Carvana, has been holding at a stubborn 12% – 13%, for what seems like months.
As of this post, BigCharts reports current short-interest at 11.67%.
Maybe that’s about to change with today’s gap-higher action (not advice, not a recommendation).
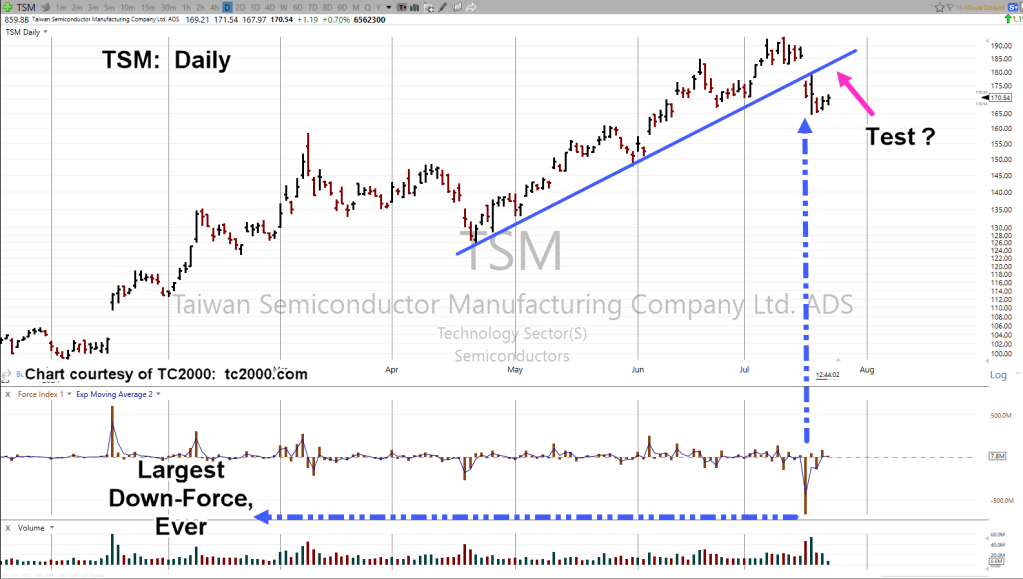
Carvana just released earnings and like the analysis of Taiwan Semi (link, here), this may be the end of the squeeze (or, the beginning of the end).
Carvana CVNA, Weekly
Pre-market action’s right at the 61.8%, retrace level.
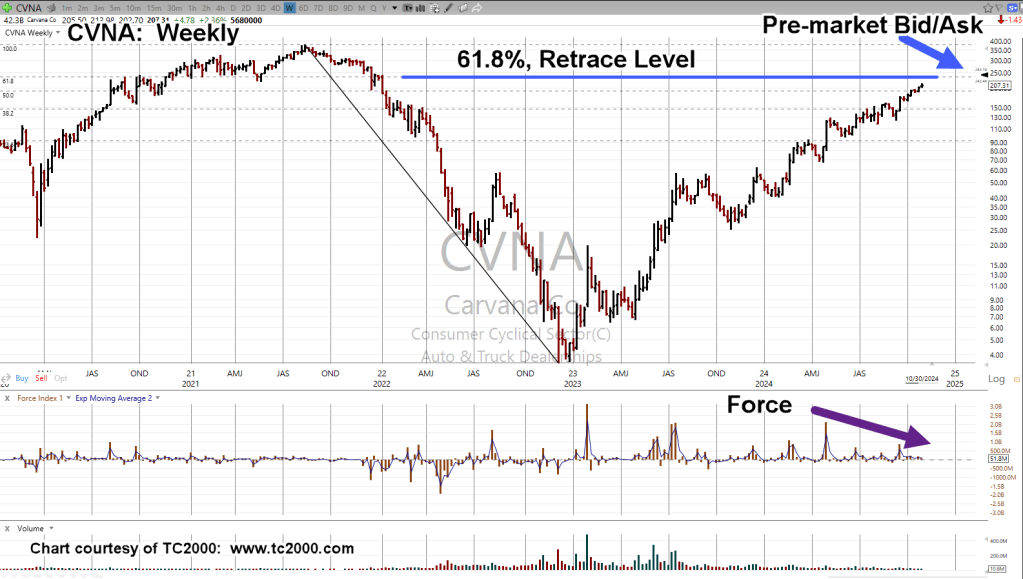
Note the magenta arrow on Force Index, middle panel.
Subsequent upward thrusts have less and less energy.
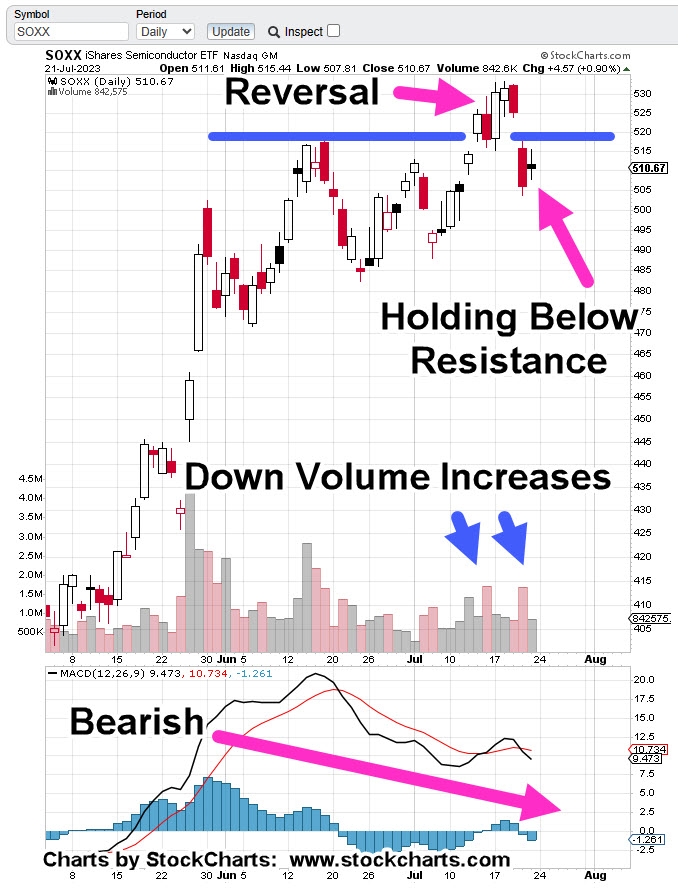
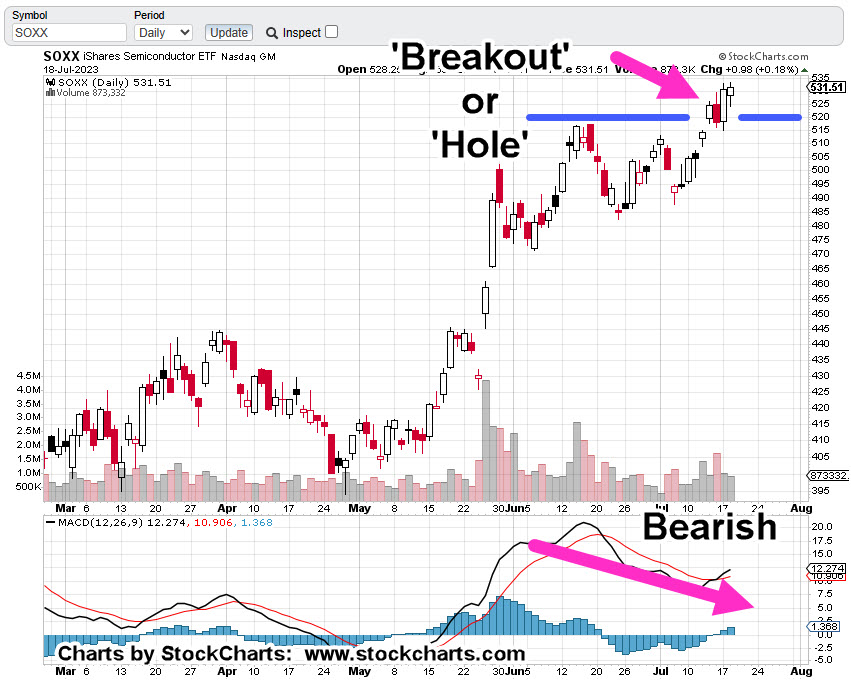
Other Markets: SOXX
We’re about twenty-minutes before the open and Semiconductors, SOXX, looks like it will confirm the downside reversal (not advice, not a recommendation).
There may also be a downtrend line in play.
More on that later.
Stay Tuned
Charts by StockCharts
Note: Posts on this site are for education purposes only. They provide one firm’s insight on the markets. Not investment advice. See additional disclaimer here.
The Danger Point®, trade mark: No. 6,505,279