We’ve already laid the ground work for dollar reversal here and here.
A reasonable expectation, reversal or not, is for the market to come back and test the support level.
Currently, in the pre-market, UUP is trading at 24.21 – 24.22, basically unchanged.
Since the divergences are taking place on the weekly chart, if there’s a reversal, it’s likely to be a sustained move.
For today, watch for UUP, to come back and test.
After that, a move higher may indicate sustained reversal is underway.
Note: Posts on this site are for education purposes only. They provide one firm’s insight on the markets. Not investment advice. See additional disclaimer here.
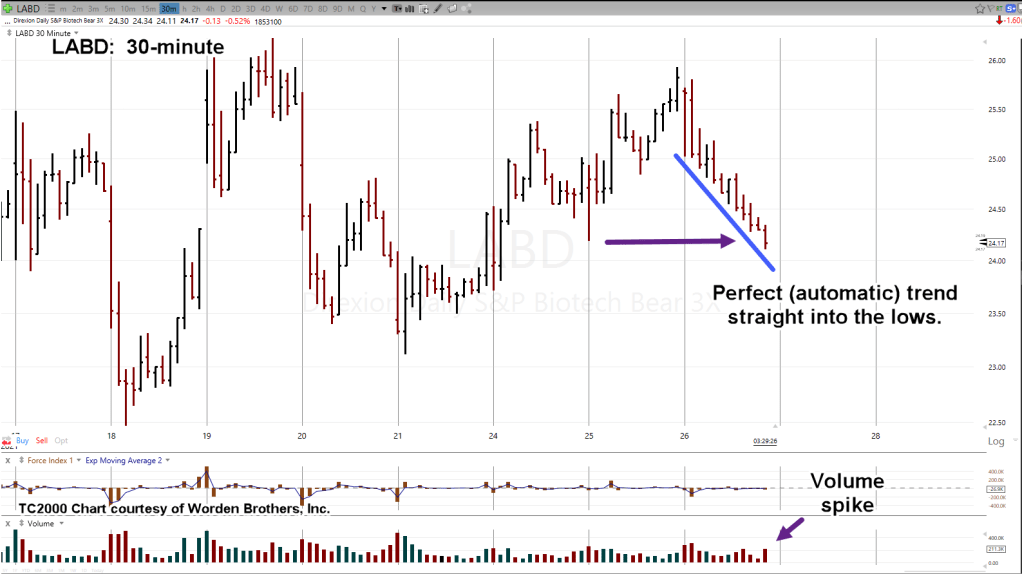
Just a minute or two after LABD penetrated yesterday’s low, a huge block trade when by on the tape.
The trading platform used shows Level II, streaming Time & Sales with transactions color coded.
The color key is as follows:
Green, Buy
Red, Sell
Purple, Sell below bid
Yellow, Buy above ask
Grey, Transaction was (buy or sell) between the bid/ask
The large block was coded Yellow: Size 18,184 shares @ 24.2699
That equates to one trade with a value at $441,323.86 … essentially a half-million dollars.
What’s the point?
If there are too many stops at one area, trade execution is automatic. This type of behavior was detailed in a prior report, linked here.
It’s not unreasonable to think today’s action was for the purpose of allocating one trade at a half-mil. Novice traders and neophytes were used as the bait (setting their stops at yesterday’s low).
Setting the stops at that location would essentially make the computer algorithms go automatic to hit the stops (as described in the Martha Stokes’ link above).
Whoever made the block trade was willing to pay above ask so the entire transaction would be filled at once.
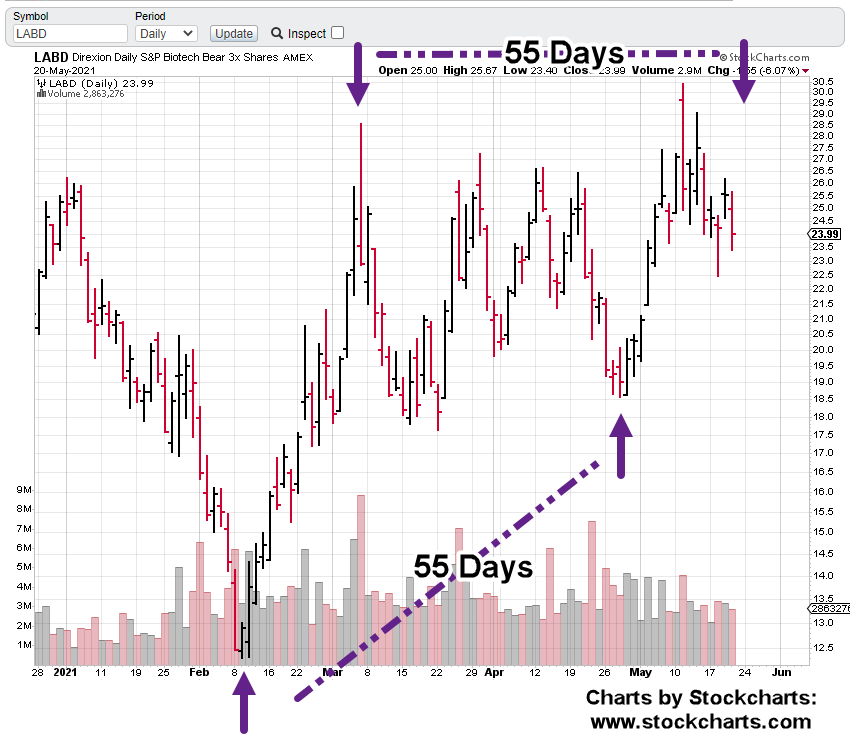
Looking at the 30-minute chart of LABD below, we see a near perfect descending line right into the lows of the prior session.
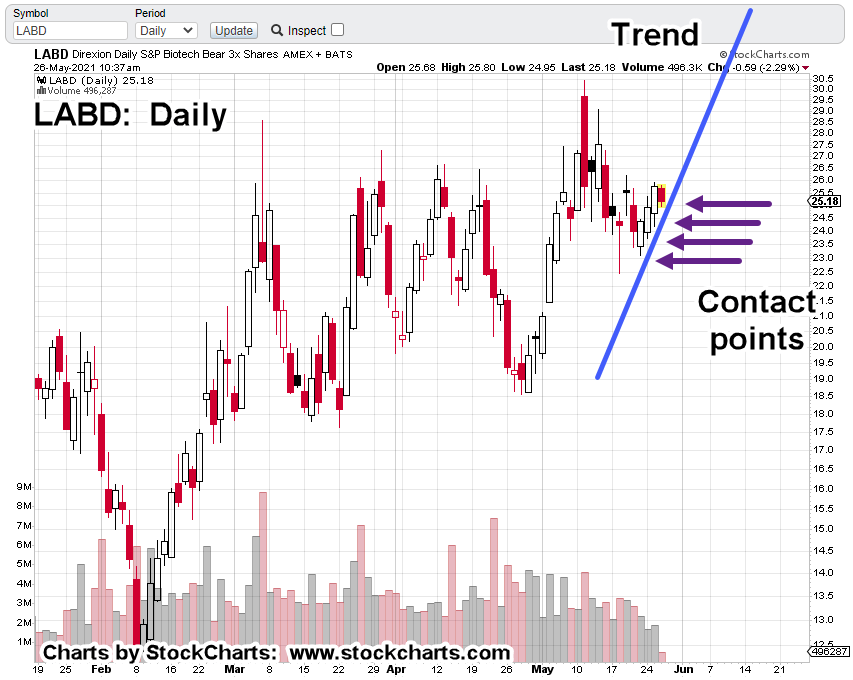
The first chart in this post has the actual close below support where the original forecast called it as a test.
The push below support on a print basis had occurred prior but the actual close below support (to complete the set-up) came two days later.
Here we are: Testing the spring set-up on a closing basis while potentially taking out the weak hands positioned long LABD.
It’s likely we’ll know tomorrow. If LABD price action opens higher and makes a new daily high, it’s a high reliability signal we’re under way.
If not, something else is at work … yet to be determined.
Note: Posts on this site are for education purposes only. They provide one firm’s insight on the markets. Not investment advice. See additional disclaimer here.
Note: Posts on this site are for education purposes only. They provide one firm’s insight on the markets. Not investment advice. See additional disclaimer here.
Note: Posts on this site are for education purposes only. They provide one firm’s insight on the markets. Not investment advice. See additional disclaimer here.
For argument’s sake, let’s just say we find out the speck came from Dubuque, Iowa.
There, problem solved.
Does that make anyone’s life any different?
Well, maybe for those in Dubuque but probably not anywhere else.
Meanwhile, the objective of constant distraction and obfuscation has accomplished its goal; ‘missed opportunities’.
That’s what it’s all about; has been for millennia.
Who decides what goes to press anyway?
Enough said.
We’re not going to get distracted with the carnival sideshow but stay focused on shorting biotech (not advice, not a recommendation).
Market Analysis:
The overall markets are up anywhere from +0.50% – 1.50%.
On the other side, we have biotech SPBIO; down -0.65%, with leveraged inverse fund LABD, up around +3.94%.
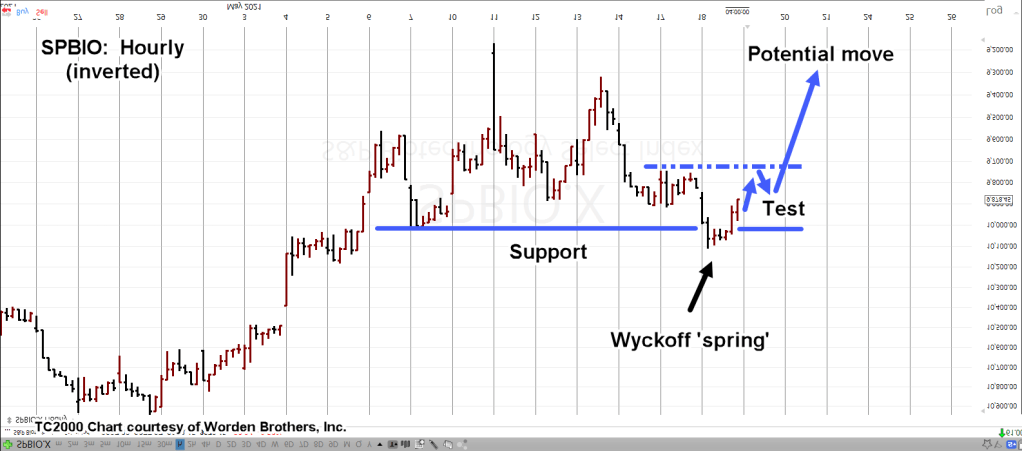
The original forecast chart for SPBIO (hourly inverted), has been updated to show where price action is at this juncture.
We’ll include all (three) charts for an easy visual on how the short (via LABD), is progressing
Newest chart first:
Price action looks like its finished testing and is now rising into the resistance area shown as the dotted line (chart above).
Reminder: It’s a forecast and it can fail (or morph) at any time.
However, thus far price action’s adhering well to probability behavior under the ‘spring’ set-up conditions.
Stay Tuned
Note: Posts on this site are for education purposes only. They provide one firm’s insight on the markets. Not investment advice. See additional disclaimer here.
However, this go-round looks to be especially poignant.
Stay tuned
Note: Posts on this site are for education purposes only. They provide one firm’s insight on the markets. Not investment advice. See additional disclaimer here.
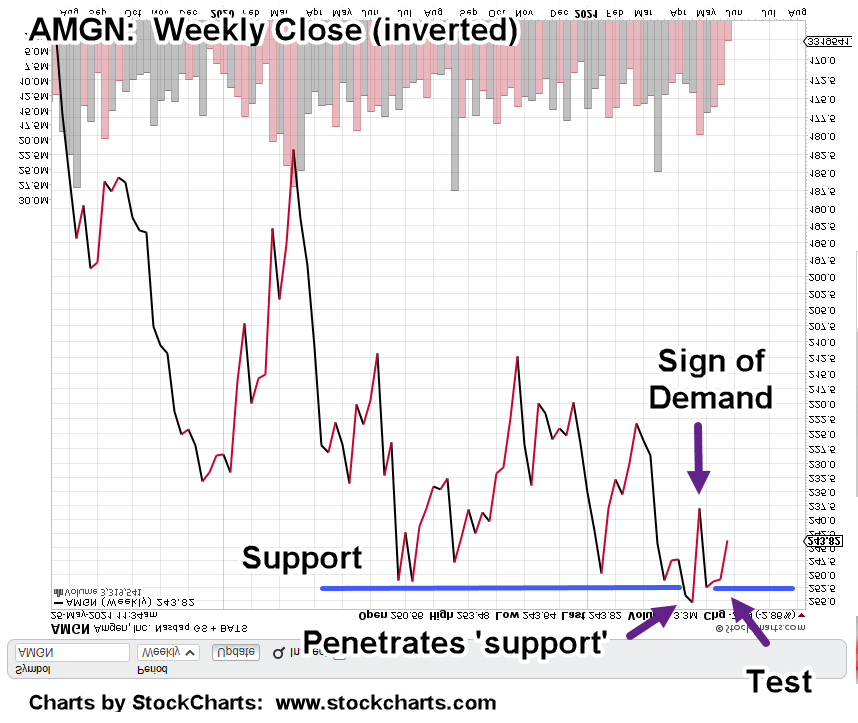
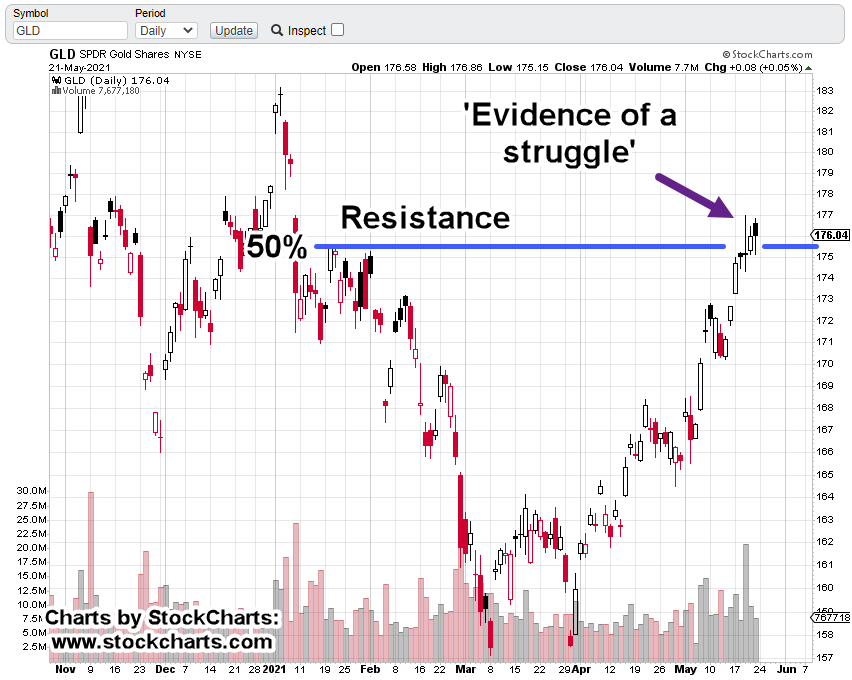
When price action penetrates support or resistance and stalls, reversal may be imminent.
At this juncture, gold and dollar, are mirror images.
Each at their own pivot point.
Gold (GLD) is attempting to push through resistance.
At the same time, it’s at the 50% retrace from the August 6th, 2020 high, and the March 8th, 2021, low.
The dollar is a near mirror image:
The correlation is not exact but has been fairly close for the past three months. Gold at a retracement high; the dollar testing support lows.
This past Friday, the dollar (UUP as proxy), did not move appreciably higher.
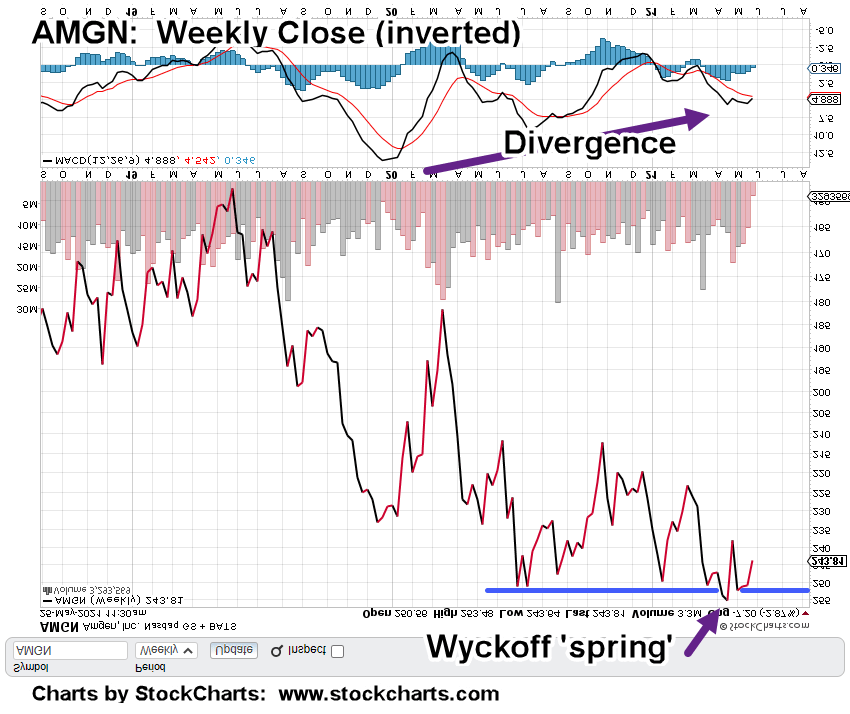
That in turn, has set up the ‘spring’ condition (weekly close basis), discussed the day prior in this report.
We can see the set-up.
Both gold and dollar at opposite ends.
Note, the dollar’s bullish divergence is a weekly time-frame set-up; giving it more weight.
If there’s a rally, it could go much higher, last longer or be quicker than anyone would expect.
If the dollar/gold correlation remains intact, as/if the dollar rallies, gold, silver and the miners would retreat … possibly, right along with an overall market reversal.
Note: Posts on this site are for education purposes only. They provide one firm’s insight on the markets. Not investment advice. See additional disclaimer here.
Note: Posts on this site are for education purposes only. They provide one firm’s insight on the markets. Not investment advice. See additional disclaimer here.
It’s easy, lazy, does not require much thought to jump on the ‘dollar crash’ bandwagon.
Everybody’s doing it.
But let’s take a look at truth.
What does the market say about itself?
If the dollar manages to close below support (shown above) tomorrow, Friday, it sets up the market in Wyckoff spring position.
Weekends are always tough. The futures markets are closed from late Friday all the way to late Sunday.
A lot can happen (and sometimes does) in that time.
If there is an ‘event’ and you have no futures access, it can be excruciating to wait until 7:30 a.m., EST (pre-market) on the following Monday.
For now, all we need to know is, if the the dollar closes below support tomorrow, it will be in position to rally (significantly) in the coming weeks if there is a reversal.
Note: Posts on this site are for education purposes only. They provide one firm’s insight on the markets. Not investment advice. See additional disclaimer here.
The forecast chart has been annotated to show where price action is now.
Biotech (SPBIO), and inverse fund LABD, are in a deep test. A little deeper than expected … but not enough to invalidate the set-up.
As of this post, price action is near the support line that’s just below the “Test” label.
Of course, the expectation is for this test to hold and for LABD to reverse back higher into the dynamic move shown; not advice, not a recommendation.
Fundamentals:
It seems like each day provides new insight into the disaster that is biotech.
This just out:
If you have been injected, The Red Cross says your blood is not wanted; your antibodies have been destroyed.
Note: Posts on this site are for education purposes only. They provide one firm’s insight on the markets. Not investment advice. See additional disclaimer here.