American Tower, Revisited

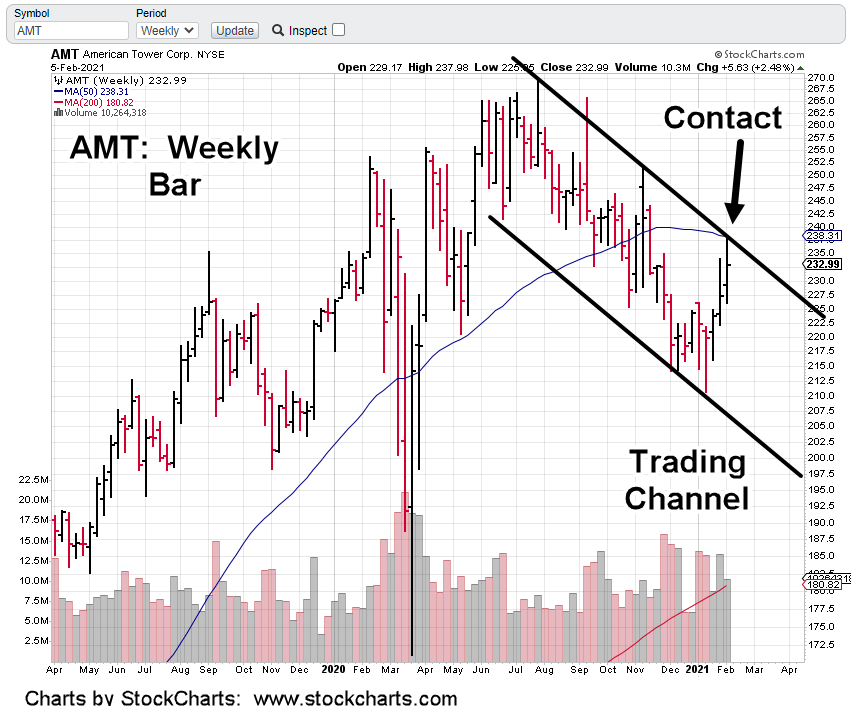
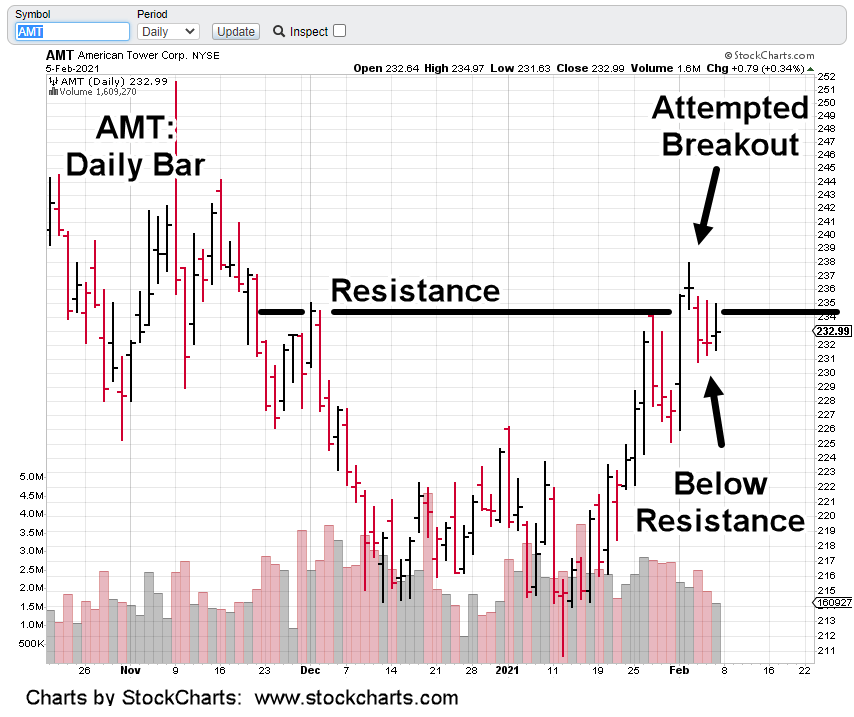
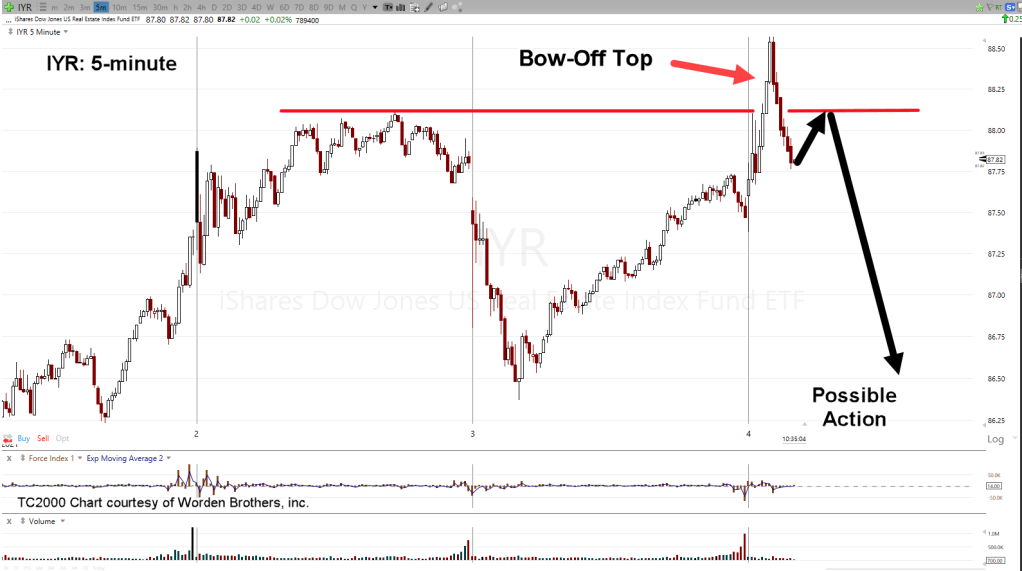
Last week, the analysis of American Tower Corp., signed off with this:

“The expectation for the coming week; AMT continues its reversal and takes the IYR sector with it.”

The chart above was provided to support that analysis.

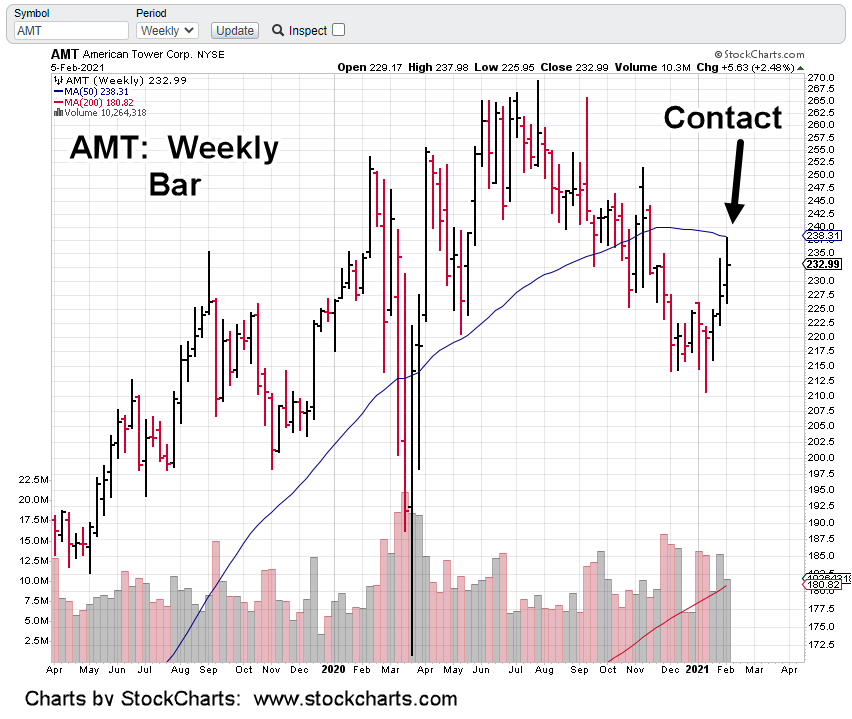
The chart below shows the result:

So, AMT met expectations by reversing on cue. Did it take the rest of the market (IYR) with it? Before that’s addressed, let’s look more at AMT.

The 3-Point P&F chart is shown below with projected targets.

For over a hundred years, this is how P&F charts are used to identify potential.

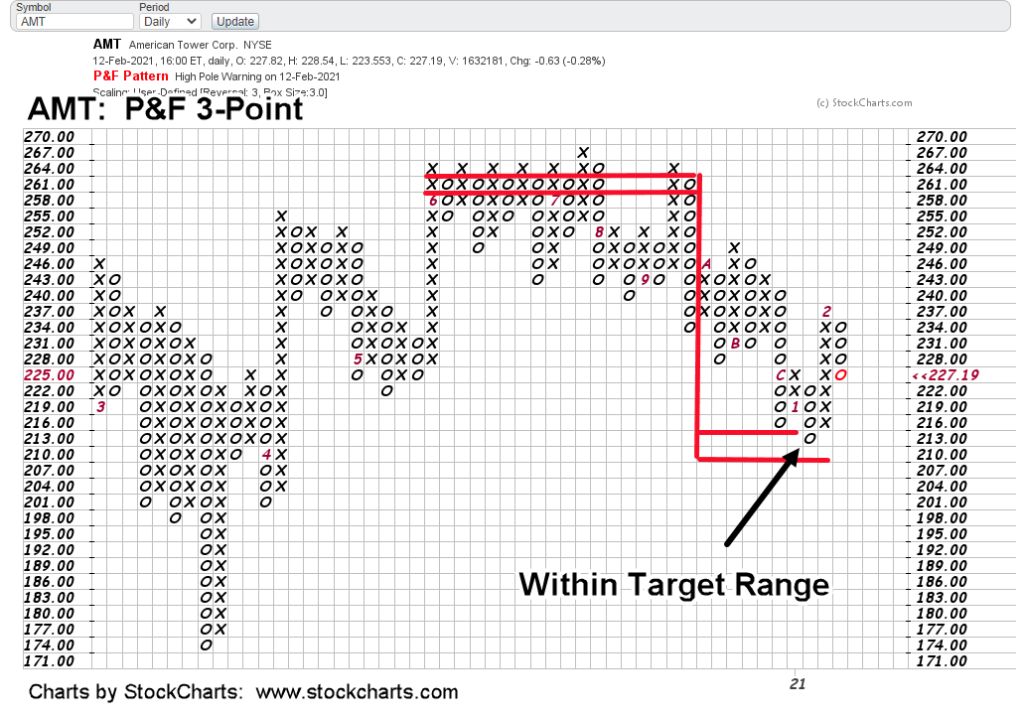
Price action indeed, met the target and then reversed.

What’s more, we can see AMT bounced off the top of the projection (~216) area first, then came back to the target.

AMT then went on a counter-trend move to ~238, before again, reversing lower last week … which brings us to now.

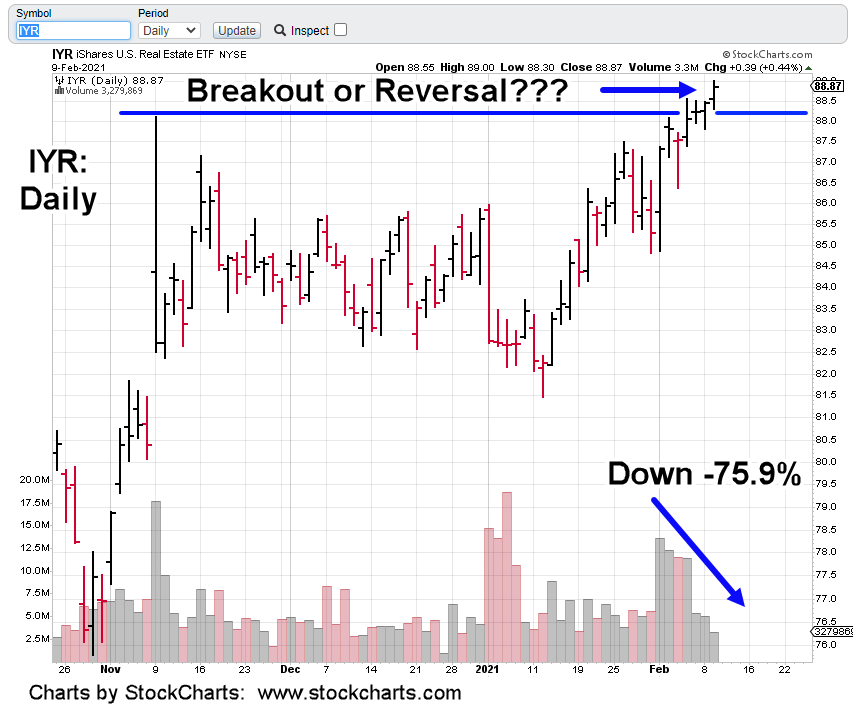
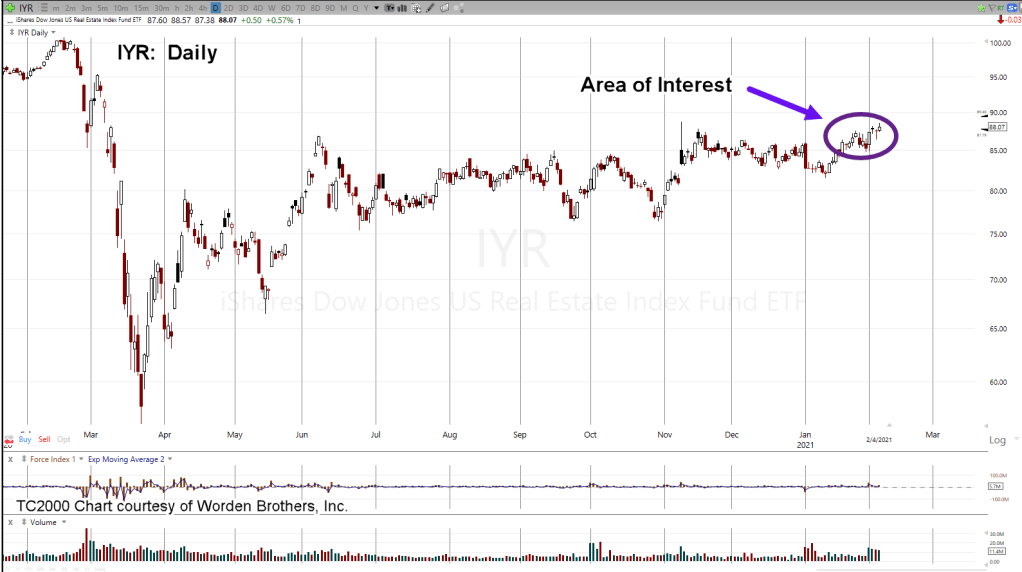
Stated several times in these updates, if and when IYR reverses, because of its own price action, it will create even lower targets.

A good illustration is to use AMT:

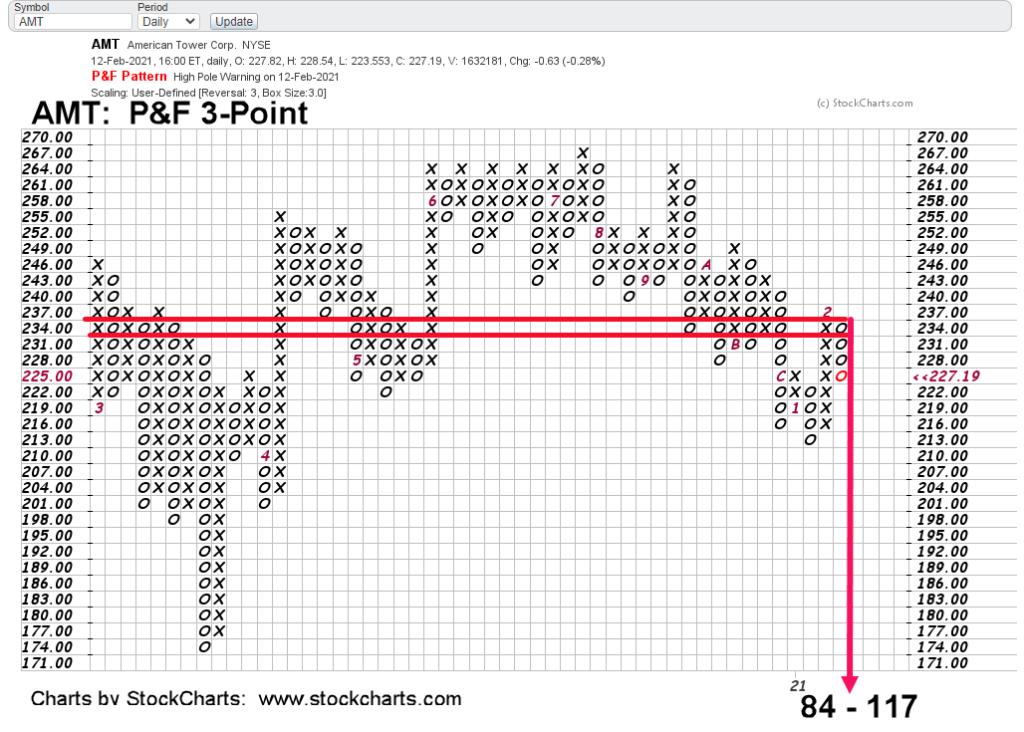
Now that its moved lower, met targets, rebounded only to reverse again, we have a new projection.

When and if IYR reverses, it will create similar downside targets.

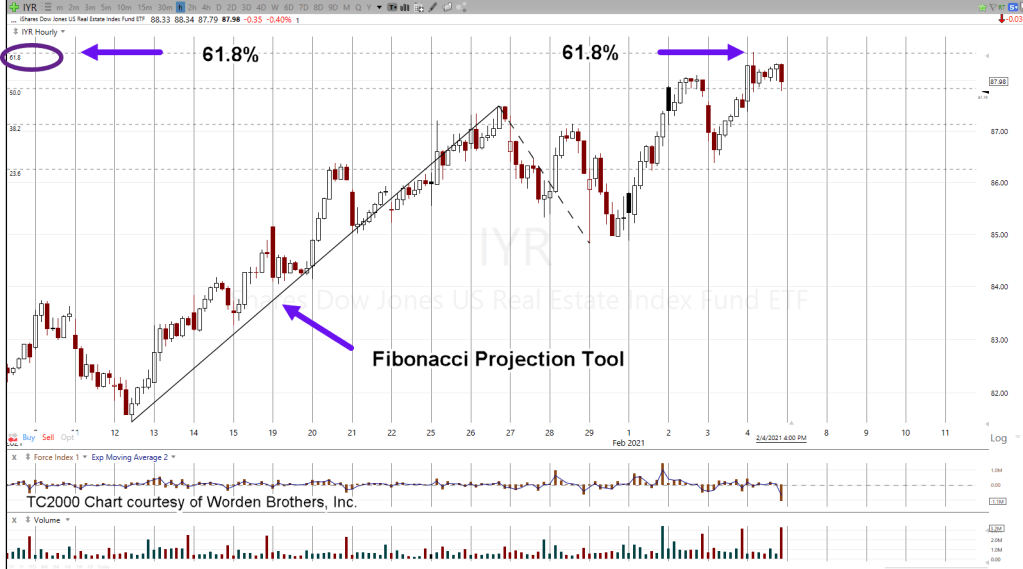
The daily chart (below) has AMT price action overlaid with Fibonacci projections to lower levels.

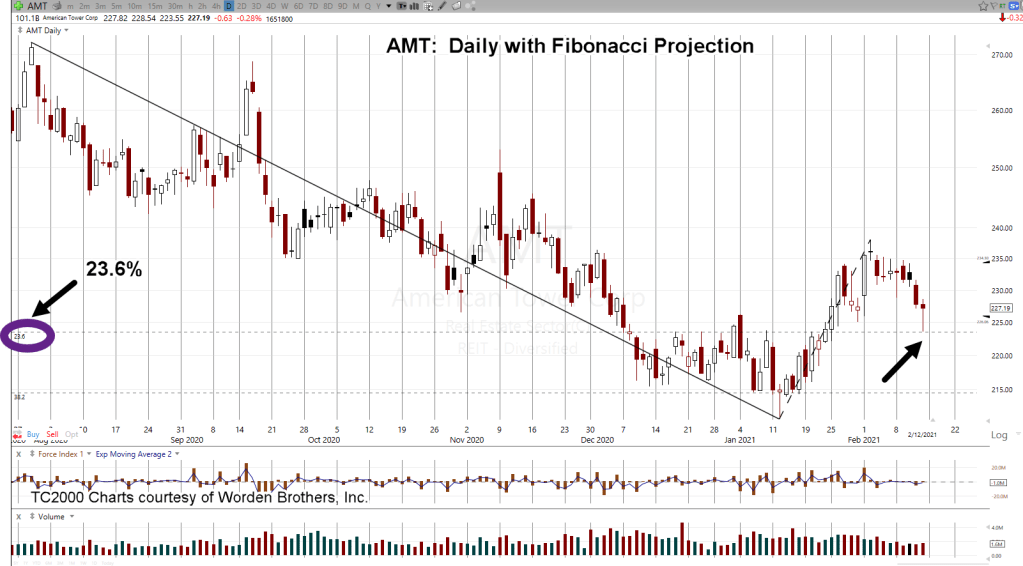
It might be a little hard to see but Friday’s action bounced off (exactly) at the 23.6%, projection.

What this means is, AMT price action is “respecting” the Fibonacci level.

That gives high probability the level is valid. If we really are in a continued AMT reversal, now we have high probability downside targets.

Tying this all together and using the weekly chart of AMT (with the Fib targets) we get this:

Note how the 1:1 projection (shown as 100.0) is near exact at the March 2020, low of 174.32.

Price action itself defines what levels are important.

The ultimate P&F projection of 84 – 117, is far below what’s shown on the weekly chart.

However, AMT: 77 – 78, does correspond to Fibonacci projection at 261.8%, … very near the ’84’ P&F low.

There’s a lot more to AMT and IYR but the post has gone on long enough.

There’s also no guarantee AMT and IYR will meet any projected levels. That is the way of the markets.

However, what’s being done is to (continue to) present a significant case for long-term sustained downside reversal; carrying the real estate sector to levels (ultimately) below that of 2009.

Charts by StockCharts

Note:  Posts on this site are for education purposes only.  They provide one firm’s insight on the markets.  Not investment advice.  See additional disclaimer here.

Not Sustainable

The Russell 2000 (IWM) puts it into perspective.

Trending higher at nearly 1,000% annualized, it’s obvious a break is coming.

Exactly how or when of course, is not known.

However, it has been proposed by this site (for years), when the final bubble-break comes, it’s likely to be an over-the-weekend event that results in a severe gap down open.

A gap down of say, 20% – 50%.

Can’t happen? After the events of 2020, we should all know that anything can happen.

Theoretically, a gap down of -25% from current levels, puts IWM right at long-time support around ~170.

Under such conditions when a severe disconnect is possible, one approach is to prepare on the short side (not advice, not a recommendation).

Using Wyckoff analysis techniques (for bear markets), that means to look for sectors not participating in the mania. When the downdraft hits, those markets will (potentially) move lower farther and faster.

That brings us to real estate, IYR

Using the same time-scale and trend line notations, we get the chart below:

From a purely visual perspective, the struggle to move higher is obvious. The past two sessions have made no net progress.

Looking more closely at recent action, IYR is following a Fibonacci time sequence.

From the low on January 12th, to the most recent high on Wednesday the 10th, is a Fibonacci 21 days.

The added bonus is the inflection point on Day 13.

Bid/Ask spreads on inverse fund DRV, in the pre-market are not that reliable; at this juncture, 8:10 a.m., EST) they indicate a higher open.

Stay Tuned

Charts by StockCharts

Note:  Posts on this site are for education purposes only.  They provide one firm’s insight on the markets.  Not investment advice.  See additional disclaimer here.

Bond Fireworks, Dead Ahead

With the highest level of short positions in bond history, it’s reversing.

Short sellers have been hypnotized after six months of non-stop downward action … sometimes the reversal begins quietly.

The clues are there. Bullish MACD in both histogram and the lines. The price action trap-gap.

The purple oval has been expanded to the left showing the ‘trap-gap’. This type of action is common during a surprise reversal.

The problem is, it’s all connected. Bonds rising indicate the economy is weak. Actually, the economy is dead (by design).

Just take a look at one of Jeremia Babe’s walk-around updates.

Businesses and malls are ‘decimated’ in his words. Here’s the latest from him … just out.

The TLT and HYG (junk bond) both reached their extremes on the same day but in opposite directions.

TLT reached its low and HYG reached its high.

Now, both those markets have reversed. The latest CPI numbers were a surprise. It highlighted that hyperinflation is not there.

That article also pointed out, rent inflation (i.e. commercial real estate) is decreasing.

One last thing. The broker used by the firm has posted a message each day upon logging onto the trade platform. That message is to the effect:

‘As a result of increased market activity, we’re experiencing especially high call volume and hold times’

This message is being posted when the market is going up!

Are any of the major brokers going to effectively handle the herd of retail calling in a panic, trying get out of a downside trading halt?

Stay Tuned

Charts by StockCharts

Note:  Posts on this site are for education purposes only.  They provide one firm’s insight on the markets.  Not investment advice.  See additional disclaimer here.

Into Thin Air …

Yesterday’s action in IYR, looks like a breakout higher.

That is, until you look at volume.

Price action levitates higher while everyone leaves the party.

From the start of the last thrust higher on February 1st, volume has declined over 75%.

There are two possibilities:

  1. Buyers and Sellers are backing away; letting prices drift.
  2. There’s no bullish commitment at these levels; reversal imminent.

Two quotes that accurately sum up the overall market situation; from Johnny Bravo and Steven Van Metre respectively:

‘One thing or the other, something’s going to break’

‘This is pretty dangerous stuff going on here’.

Before we wrap up, we’ll add just one more thing.

Junk yields have sunk to record lows.

Why buy TLT at ‘relatively’ safe 1.55%, when you can have junk yield at 3.95%, that’s going to blow-up (launching TLT into the stratosphere) at any time.

Stay Tuned

Charts by StockCharts

Note:  Posts on this site are for education purposes only.  They provide one firm’s insight on the markets.  Not investment advice.  See additional disclaimer here.

Silver Short Squeeze, Over

Massive volume in SLV, points to significant reversal.

Not since the week of May 13th, 2011 has there been higher volume.

The week prior in 2011, was the highest volume ever, for SLV at 1.1-Bilion shares.

Those two weeks culminated in a crash over -31% and were just after SLV reached its all-time high.

Total down-draft for the three weeks combined (the top and two weeks following) was nearly -34%.

Will it be any different now?

Probably not.

At this point, it’s important to re-state, this site is following principals and techniques set down by three market masters of the early 1900s; Livermore, Wyckoff and Loeb.

Markets do not change. Using the techniques outlined by those early masters are still applicable today.

Arguably, the father of technical analysis was Wyckoff.

The terms “accumulation, distribution, support and resistance” originated from him.

His technical publications had the largest subscriber base in the States at the time; larger than all other publications combined.

At one point he got so successful, his buy or sell recommendations were beginning to move the markets all on their own. The year was 1918.

Instead of stroking his ego on how ‘his recommendations’ were affecting the markets, he saw it as a disservice to his clients.

In May of 1919, he discontinued his newsletter publication ‘The Trend Letter’. It had become so popular, it was impossible to provide recommendations without those same tips moving the market.

What a contrast to today.

Those attempting garner forces (the little guy) to move the markets, such as silver, will find out soon enough who’s in control … and it’s not them.

It’s unlikely silver is going higher any time soon. There could be some upward spasms as the crowded trade exhausts itself; it’s likely we’ve seen the SLV highs for quite some time.

Stay Tuned

Charts by StockCharts

Note:  Posts on this site are for education purposes only.  They provide one firm’s insight on the markets.  Not investment advice.  See additional disclaimer here.

Real Estate: At the Pivot?

Just a few minutes into the session: IYR has posted a new daily low. Friday’s low, 89.75 was penetrated quickly.

We’re in nuanced territory.

IYR is hovering as if undecided.

Price action could recover and go on to new highs. However, looking at the weekly chart above, IYR filled the gap during last week’s action.

American Tower, AMT (researched over the weekend) has also posted a new daily low; potentially confirming its long-term reversal.

We’re at The Danger Pont: This is where risk is least.

Maintaining short IYR via DRV (not advice, not a recommendation).

Charts by StockCharts

Note:  Posts on this site are for education purposes only.  They provide one firm’s insight on the markets.  Not investment advice.  See additional disclaimer here.

AMT: Case For Reversal

The largest cap equity in the real estate sector IYR, is American Tower Corp. (AMT).

We’re going to spend some time dissecting this equity but first, let’s look at the big picture (above).

The same chart is posted below having two areas highlighted with blue circles.

Zooming into the upper-right circled area (shown below). The circle has been removed to help provide clarity on the technical situation:

Next, we’re going to add a trading channel to the chart:

Now, we’ll zoom into the daily charts:

Drilling down even further on the daily:

From a fundamental standpoint, AMT has a P/E of 55, and is yielding an anemic 1.94% (as of 2/5/21, bigcharts).

That compares to a current TLT, yield of 1.55%

The last three earnings releases have each been downward surprises; averaging -6.6%, against expectations.

Getting back to the technical condition.

The second weekly chart had two areas circled. These are the only two places (in over fourteen-years of price action), where the 50-Week MA is pointed down at similar angles.

The first circle, AMT was rising into the declining MA as part of a long term bullish reversal.

The proposition at this juncture, based on fundamental and technical conditions, AMT is rising into a declining 50-Week MA as part of a long term reversal to the downside.

Price action is the final arbiter. Anything can happen.

The next earnings release for AMT is scheduled for February 25th (Yahoo Finance) so it’s not going to be a near term factor.

The expectation for the coming week; AMT continues its reversal and takes the IYR sector with it.

Stay Tuned

Charts by StockCharts

Note:  Posts on this site are for education purposes only.  They provide one firm’s insight on the markets.  Not investment advice.  See additional disclaimer here.

Bonds: Measured Move, Met

From the wedge breakout to the downside, Friday’s action in TLT has met the measured move.

Price action finished at the low of the day (+0.01) and is posting a bullish MACD divergence.

On the other end of the spectrum, the S&P 500 finished at all time highs.

Intuitively, we can see how this is setting up.

Each market is at an extreme. That includes real estate, IYR at its own 76.4%, retrace … although severely lagging the S&P.

Unfortunately at such junctures, we can expect some type of ‘incident’ to set things off in the opposite direction.

It may not happen but if it does, the markets define the news; not the other way around.

Stay Tuned

Charts by StockCharts

Note:  Posts on this site are for education purposes only.  They provide one firm’s insight on the markets.  Not investment advice.  See additional disclaimer here.

Le Denouement

The final outcome. Real estate IYR has met key technical points that indicate reversal is imminent. It might not be much of a turn at the start, but the market rarely announces its intent.

Time spent analyzing real estate seems like forever; it’s actually only been a few weeks. The daily chart above, puts it into perspective.

For the most part, trading and positioning action has been focused on the tiny circled area. Not advice, not a recommendation.

To be concise, we’ll list the known facts about the current juncture.

  • IYR is at Fibonacci 76.4%, retrace level from the down move that started in February – March last year.
  • Price action has met a Fibonacci 61.8% projected move off ‘a-b-c’ wave action from the January 12th, 2021 lows.
  • While meeting that 61.8% projection, price action formed a terminating wedge; complete with a throw-over early in the session yesterday.
  • Price action closed below the prior near time high of 88.11 (close was at 88.07).
  • High levels of volume over the past four sessions, indicate distribution; just as it indicated accumulation at the beginning of the current move. The “Book-Ends”
  • Successive lower momentum energy with each net upward close since April 9th, 2020.
  • Supporting the potential for market reversal, bonds are at short level (and price) extremes and the dollar has already reversed.

The area of interest shown in the daily above has been expanded to hourly charts below:

It may be a little hard to make out the Fibonacci numbers (61.8%, circled), but early yesterday, price action posted higher and reversed off the Fibonacci 61.8% level.

The hourly below, shows in addition to meeting Fib targets, a terminating wedge had also been formed:

The last chart, the daily, has IYR posting right at Fibonacci 76.4% retrace of the entire down move from February – March last year.

If IYR does not reverse at this juncture (or within tenths of a point), then it’s headed to much higher levels.

Considering all the facts; the extremes, bonds, dollar, and now gold and silver in a deflation impulse; significantly higher prices for IYR seem unlikely indeed.

Stay Tuned

Note:  Posts on this site are for education purposes only.  They provide one firm’s insight on the markets.  Not investment advice.  See additional disclaimer here.

Blow-Off Top

Showing signs of a blow-off top, IYR has reversed back below resistance. It may come up to test before heading dramatically lower.

The close of this session will be important.

Above resistance and IYR has a new lease on life. Below resistance and it’s likely we’ve seen the last of these levels for a very long time.

Note:  Posts on this site are for education purposes only.  They provide one firm’s insight on the markets.  Not investment advice.  See additional disclaimer here.