Over the past seven weeks, as the biotech indexes worked their way through a corrective retrace, there were no guarantees we’d get such an obvious reversal.
A market disconnect could have happened at any time (and is still a possibility).
At this juncture with SPBIO, penetrating and rejecting a prior resistance area, we’re likely on the way to much lower levels.
The daily SPBIO is below. The next chart has it inverted with notations added:
Inverted. Notations added:
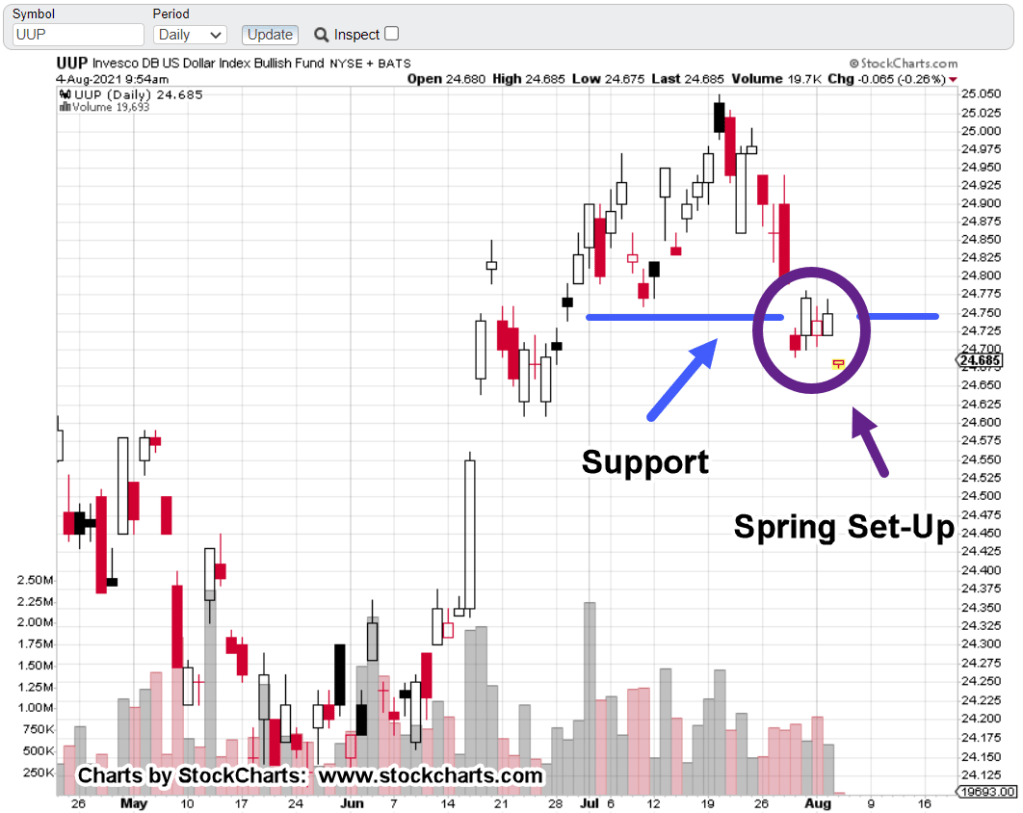
We see penetration below the blue line support area. This sets up the Wyckoff spring condition (up-thrust, non-inverted).
The last update, showed thrust energy already divergent; set for reversal.
Note:
The criminal behavior within this sector continues to mount by the day.
Operating with impunity.
When, how, or if that breaks out into the open, is the big unknown.
SPBIO, Character Change:
One of the benefits (if you can call it that) of having a position that’s eroding by the day, is that you get very intimate with the behavior of price action.
Consider it an ‘opportunity’ to focus the mind.
The typical behavior of SPBIO (and inverse LABD), is to establish the day’s trading range within the first two hours of the session.
Consider those two hours as the ‘head fake’ as that range is then eroded throughout the rest of the day.
Today’s session has been no different. A wide range established early but here’s the change; There’s been little, to no erosion.
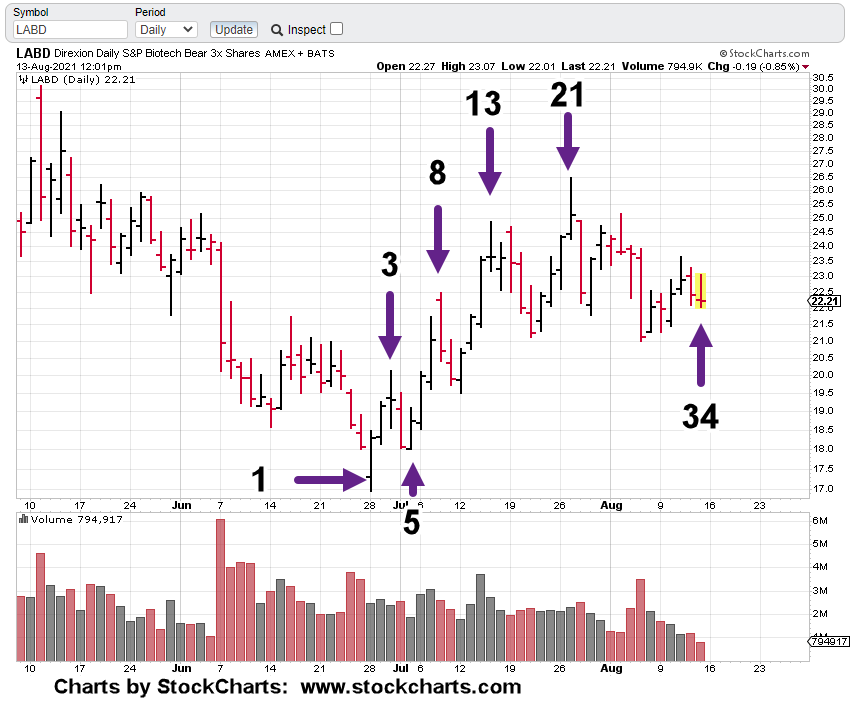
As if on cue, during the third hour of trade, SPBIO attempted to erode the range. Inverse LABD, shown below.
However, that attempt appears to have been rejected:
As of this post, price action can’t get itself (appreciably) back into the early morning’s range. The character of the index has changed.
Stay Tuned
Note: Posts on this site are for education purposes only. They provide one firm’s insight on the markets. Not investment advice. See additional disclaimer here.
The very last thing you’ll need in that environment, is a stack of metal (not advice, not a recommendation).
Personal anecdote, skip to GDX Chart, if not interested.
These updates are originating from the North-Central area of Texas (DFW). When the historic cold snap rolled through this past February, the power went out repeatedly.
The first thought was not: “I’m sure glad I have my stack of silver to get me through”
No. The thinking was (in this order):
Food, water (water was second as there was plenty of it just outside as snow), munitions and ‘delivery mechanisms’, cash in case the gas station was operational … which is was not and then lastly, heat.
The location was using natural gas for heating and was available as long as there was power
Precious metals were nowhere on the list … not even considered. They had nothing to do with the situation at hand.
Note: Posts on this site are for education purposes only. They provide one firm’s insight on the markets. Not investment advice. See additional disclaimer here.
In the entire history of the market, that’s never happened before, either.
Biotech Backdrop:
We’ve got empirical and anecdotal evidence pointing to the real objective of the ‘experiment’; now, we’re fortunate enough to have a data analyst doing what the medical establishment used to do.
Note: Posts on this site are for education purposes only. They provide one firm’s insight on the markets. Not investment advice. See additional disclaimer here.
Sentiment can’t be seen on the chart. One can guess but it can’t be measured directly.
Sentiment change comes first.
That change in turn, results in a change of volume, i.e. ‘commitment’.
Then, after commitment dissipates, price is next.
That looks like the current situation with biotech and specifically inverse fund, LABD.
In what may be an idiot or genius move (depending on outcome), the short in biotech SPBIO (via LABD) has been maintained throughout the current down thrust; not advice, not a recommendation.
The reasons for that decision have as many layers as the proverbial onion. Not the least of which, is a market break anywhere from 20% to 50% (in our view) can happen at any moment.
‘Never happened before’, one might say.
Oil futures in their entire history have never gone negative before, either.
Bonds, in their entire history have never been shorted by four-standard deviations before, either.
A world-wide coordinated push to euthanize the entire population has never happened before, either.
Margin debt and valuations have never been higher before, either.
Underlying liquidity has never before been removed to the current extent, either.
So, we each have our own reasons.
The firm’s main account (not the Project Stimulus account) has drawn down about – 13%, on the current short position.
A core position has been maintained but small amounts have been removed and added based on price action.
When the anticipated gain, is high hundreds of percent and maybe above 1,000%, the draw down above, looks acceptable considering the (potential) opportunity.
On to the chart:
The daily chart of LABD, shows both net downward price action and thrust energy are dissipating.
Note the ‘Force Index’ scale has been accentuated to better show the divergence.
We’re looking for price to move back higher to test support/resistance areas.
If or when it does, the plan (as has been from the beginning) is to continue to add LABD until volatility makes it prohibitive.
Stay Tuned
Note: Posts on this site are for education purposes only. They provide one firm’s insight on the markets. Not investment advice. See additional disclaimer here.
Crisis will create opportunity for leadership; at this point, there’s not much if any in the financial sector (i.e. ‘best ever’, above).
When the big melt-down hits, leadership’s not coming from the ranks of the ‘compliant’ or the enforced mediocrity of the ‘fiduciary’.
Therefore, we can all take our cue; like this Irish couple who took it upon themselves, to separate from the crowd and escape quarantine.
With that in mind, on to the markets:
Analysis, Biotech
As we head towards the close with about twenty minutes left, the S&P 500, has posted an all-time high.
Biotech, SPBIO and IBB, are still well below their highs but are nonetheless at a point of instability with today’s action.
As the Hourly chart of LABD shows, we’re at the danger point and in spring condition:
A push back into the range above support, is significantly bullish for LABD and bearish for SPBIO.
Stay Tuned
Note: Posts on this site are for education purposes only. They provide one firm’s insight on the markets. Not investment advice. See additional disclaimer here.
It’s natural market behavior to rebound after a breakdown low.
Stops are hit; Amateurs sell and sell short. Professionals cover their shorts; go long or look to short again.
It’s what happens next, that’s important.
The market, DIA will likely come back to test the support/resistance boundary (blue line) in the daily chart above.
At this juncture, even though Dow Theory Sell was triggered (not advice, not a recommendation) with DIA closing below support last Friday, from a Wyckoff standpoint, DIA is in spring position.
Spring position; the market’s poised (but not guaranteed) to move higher.
If DIA comes back to test the boundary (typical behavior), there are two outcomes:
No. 1:
The test holds; price reverses and we’re on to potential new highs
No. 2:
The test fails; price re-penetrates the lows and then heads (much) lower.
Adding weight to the second scenario, DIA has already posted a new monthly low. That’s not happened since October last year.
Stay Tuned
Note: Posts on this site are for education purposes only. They provide one firm’s insight on the markets. Not investment advice. See additional disclaimer here.
For what seems the longest time, a recurring focus of this site has been the biotech sector.
Specifically, the IBB (ETF) and SPBIO (Index).
There’s good reason for that. In this update, we’ll go deeper into the downside opportunity.
Biotech Reversal:
SPBIO, topped out on February 9th this year. The IBB (ETF) topped one day later.
Both went on to form a Quarterly reversal bar; indicating a long term change in character.
Of the two, SPBIO has showed more weakness having posted monthly lower lows for three successive months.
That relative weakness over the IBB index, has resulted in focusing on the inverse of SPBIO; specifically the 3X inverse, LABD.
Working with leveraged inverse funds is only profitable on a short-term basis or when the underlying index is in a persistent down-trend.
Otherwise, typical market chop results in value erosion of the inverse fund (not advice, not a recommendation).
For the reasons discussed in the last section below (Nuremburg 2.0), we’re anticipating the index to have a sustained and persistent drop to much lower levels.
Downside Projections:
Going way back to Reminiscences of a Stock Operator and the Wyckoff Stock Market Institute training materials, both in their own way indicated a speculative position was only entered if there was sufficient potential.
Livermore’s 10-points or more and Wyckoff’s cause and effect
In Wyckoff’s case, the ’cause’ was price action congestion built up in the P&F chart.
The ‘effect’ was the resulting move.
Which brings us to now:
Many times on this site, we’ve said biotech has built up congestion in a way, when it reverses and begins its decline, price action itself will create lower targets.
We’ll present two charts showing how that’s happening.
The first P&F chart in this update and provided below, has a projected downside target for IBB around, 116 – 120 area:
Note, the downside is not to scale as the real location is far below the noted area.
Biotech IBB, then went on to post lower action. That in turn has resulted in an updated downside target:
Once again, the downside is not to scale.
It’s apparent, as IBB heads lower, it successively builds lower targets and it’s only (potentially) just getting started.
The weekly chart of IBB below, spells it out:
If and when IBB price action gets to the initial targets, it enters a congestion area that will (by that time) be over seven years wide.
If the trend is still down, that congestion in turn would target even lower levels.
The “-80%” interestingly enough, comes from a quote by Steven Van Metre at this link.
That 80% drop also corresponds to a downside Fibonacci (not shown) projection of 423.6%, on the above chart.
Nuremberg 2.0
This phrase has become so ubiquitous you can do a search for it.
So far, not a single mainstream financial site or YouTuber (still on that platform) has mentioned this fact in their analysis.
The speck injections are mass genocide and intended as such.
Two recent events resulting from injections are here and here.
If all of a sudden, injected pilots can’t fly (the first link), how are goods going to be transported?
Not generally known to the public, commercial air-transport is also used to haul freight (while carrying passengers).
Exactly how all of this (world crime) will break is unknown.
If and when it does, the result in the biotech sector as well as equities in general, could be successive air-pockets all the way down.
Note: Posts on this site are for education purposes only. They provide one firm’s insight on the markets. Not investment advice. See additional disclaimer here.
In fact on June 9th, the day the above ‘penetration’ report was posted, gold (GLD) had already reached its peak and was in a reversal.
Five days later (before the major down-move), this report was published on gold.
Therefore, at this juncture, we’re still inversely correlated.
So, what does that mean?
The updates on the dollar have proposed, since the bullish divergence (now turned rally) is on a longer, weekly time frame, the ensuing move could have the potential to carry the index UUP, to the top of the trading range shown here.
Then, what happens to gold?
If the negative correlation remains intact, gold gets whacked.
The weekly chart of GLD (above) has the index closing right at the Fibonacci 38.2%, projected level.
Wide bars tend to get tested. There could be some kind of rally in the coming week but it’s not required.
The Fibonacci projections highlighted as the orange bars, go all the way down to 161.8%. That’s equivalent to GLD at ~ 118.65, or the futures market somewhere around $1,300 – $1,350.
With the Dow 30, (DIA) penetrating and closing below the 336, support levels on Friday, we have a Dow Theory Sell Signal (not advice, not a recommendation).
The markets appear to be rolling over.
The last market reversal in February – March, of last year, had GLD dropping over – 14.5%, in two weeks.
Fast forward to now; GLD, is already down over – 15.2%, from its August 2020, highs.
Stay Tuned.
Note: Posts on this site are for education purposes only. They provide one firm’s insight on the markets. Not investment advice. See additional disclaimer here.