Real Estate Breakout … Down

Interest rate sensitive markets are on the move … lower.

Updated 3:02 p.m. EST, as noted below

Fastenal (FAST), Home Depot (HD), Lowes (LOW), Real Estate (IYR), Weyerhaeuser (WY), Homebuilders (XHB), all taking a hit early in the session.

In their own way, there’re interest rate sensitive and related to real estate, construction or maintenance.

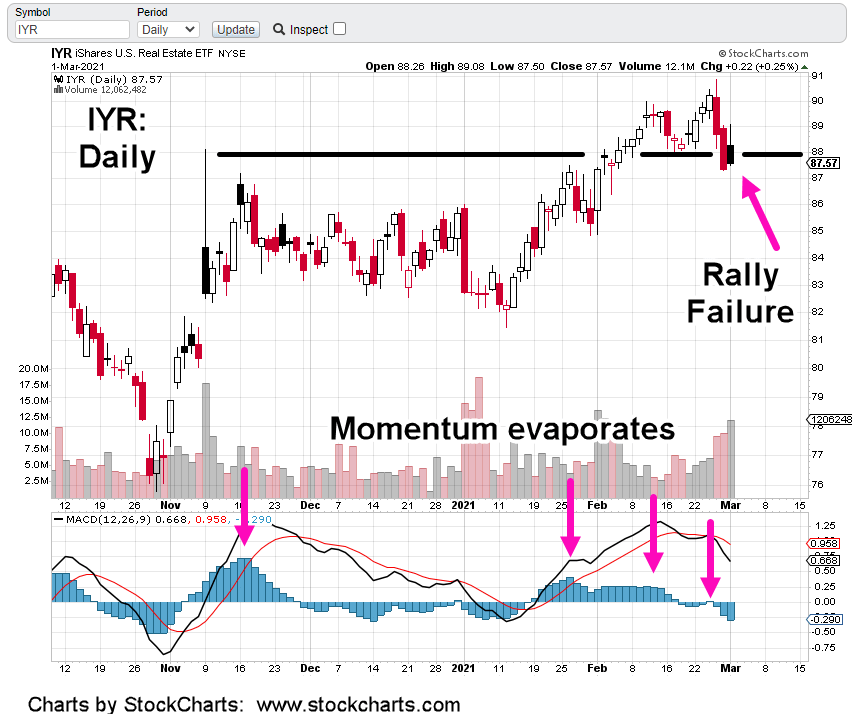
Since mid-January this year, real estate, IYR was identified as a potential strategic short opportunity.

Numerous shorts (via DRV) were opened, some exited (not advice not a recommendation).

On February 25th, it was obvious in early trading, this is it.

Reversal at hand.

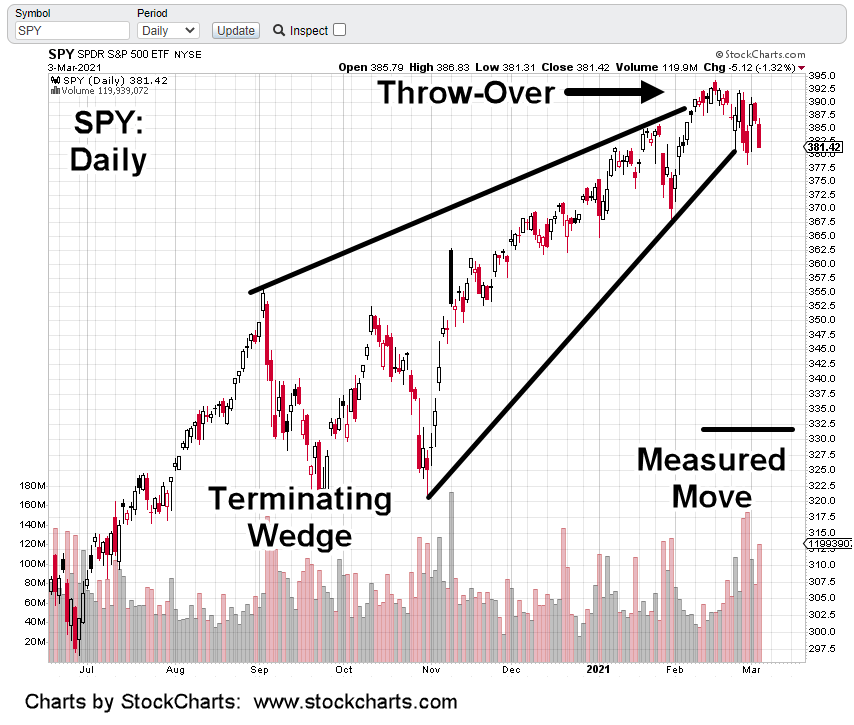
The last of the shorts via DRV was opened and documented here (not advice, not a recommendation). Now in today’s session, we have a completed wedge and apparent downside breakout in progress.

There’s a lot of congestion to get through before (if and when) IYR reaches ‘free-fall’ territory. A lot could happen between now and then.

Even so, it’s fairly safe to say, price action’s not likely to come back to the IYR session high.

But that’s exactly what it did … and pushed just a bit higher (+0.15-pts).

So, we’ll set the DRV stop at that location (session low) … approximately 9.41; not advice, not a recommendation.

With the above push, the DRV stop will be set at today’s session low (currently 9.39).

Stay Tuned

Charts by StockCharts

Note:  Posts on this site are for education purposes only.  They provide one firm’s insight on the markets.  Not investment advice.  See additional disclaimer here.

Set The Stop

“Set the stop and walk away”.

That was a phrase from the late David Weis, used during his training session video (link here).

That’s what we’re gong to do.

Biotech (IBB) is nearing support and it was thought the overnight would result in an obvious gap-down open, exit signal.

However, with just about a half-hour to go before the regular session, markets maintained their positions overnight keeping the door open for continued decline or counter-trend action.

All markets, the S&P, Dow, Nasdaq, (and biotech) are pivoting lower from insane valuations. We could be at the very beginning stages of a sustained deflationary move.

One example of how such moves behave, was the oil market in July of 2014. The tracking fund USO, had nine successive down months (declining over 60%), before a significant retrace.

With that in mind, we’re setting the LABD stop at the prior session low of 21.80 (not advice, not a recommendation).

With an LABD entry point at 18.08, being stopped out at 21.80, would yield a gain around 21%.

So, we’ll leave it there and move on to other opportunities.

The weekly has IBB, nearing support around 140 – 142 (dashed line). We can expect price action to hesitate as (or if) it encounters those levels.

Stay Tuned

Charts by StockCharts

Note:  Posts on this site are for education purposes only.  They provide one firm’s insight on the markets.  Not investment advice.  See additional disclaimer here.

Overnight, Pre-Market

Markets might continue their decline in overnight and pre-market.

If pre-market or early regular session has IBB trading near its target level, we’ll plan on exiting (LABD) in response; not advice, not a recommendation..

Every other active trader sees the H&S at this point and is probably waiting to close out (their shorts) at or near the bottom.

If so, it may result in buoyancy and the trade will start to degrade; exit is warranted under those conditions.

Charts by StockCharts

Note:  Posts on this site are for education purposes only.  They provide one firm’s insight on the markets.  Not investment advice.  See additional disclaimer here.

S&P 500: Downside Target

If the analysis is correct and the S&P’s completing a terminating wedge, then we have a downside target.

The measured move is around 330 – 333. Reaching that level would put the SPY down about 16% from all-time highs.

If that happens, expect the usual suspects (the financial press) to say, ‘well, a bear market is 20% or more … so we’re good’.

Let’s see how that works out.

Charts by StockCharts

Note:  Posts on this site are for education purposes only.  They provide one firm’s insight on the markets.  Not investment advice.  See additional disclaimer here.

Amgen (AMGN) Breaking Lower

Amgen’s the largest cap in the biotech sector ETF, IBB.

Loss of momentum (magenta arrow) is clear.

Upside energy (weekly) MACD has been dissipating for over a year.

So, this is no transient direction change. Zooming into the daily chart shows hesitation at the trend line.

Then last Friday, a significant move away from that trend.

When there’s a trend break, typically there’ll be a test of that break.

In this case, such a test would cause price action to move higher; testing the underside of the trend.

Because there’s been so much congestion at the trend line, we may not get the upside move.

It may have already self-tested. From here, price action could just make its way down to the measured move target ~ 164 – 165.

Positioning:

We’re short this market via LABD (not advice, not a recommendation) and have moved the stop to 18.17, based on yesterday’s action.

Summary:

If AMGN decides to test the trend underside, it’s likely to stop out LABD.

If price continues to decline (unabated) to target levels, we’ll probably exit at pre-identified IBB, target ~ 138 – 140 (approx: 35 – 38, LABD).

Stay Tuned

Charts by StockCharts

Note:  Posts on this site are for education purposes only.  They provide one firm’s insight on the markets.  Not investment advice.  See additional disclaimer here.

Real Estate: Off The Chart

New downside targets for IYR are literally, ‘off the chart’.

There’s a good deal of support in the 84 – 86 area. So, price action hesitation is to be expected.

However, technicals and fundamentals have aligned themselves. Conditions are now in place for a persistent, sustained decline.

Charts by StockCharts

Note:  Posts on this site are for education purposes only.  They provide one firm’s insight on the markets.  Not investment advice.  See additional disclaimer here.

Failed Rally Attempt: Real Estate

Nothing gets sharks in the water faster, than a failed move.

Last Friday, real estate IYR closed below support (black line). Doing so, put itself in Wyckoff spring position.

‘Spring position’ is a technical condition of instability where price can reverse dramatically.

At the open yesterday, that’s exactly what happened. IYR launched nearly instantly to a 50% retrace.

From there it was a long day of moderate price erosion all the way to the last hour; then it all went south.

IYR closed just 0.22 points higher or +0.25%, after being as high as +1.73 points (+1.98%), early in the session. In addition, that close was back below support on the heaviest volume since February 2nd. … another bearish sign.

We can see momentum, MACD has exhausted itself and posted numerous bearish divergences.

On the fundamental side, just in the past 24-hours, there’s been a raft of news articles posted showing commercial real estate’s in serious trouble.

A short list of what has been found is below:

Mortgage market.

Mall values crash.

Bond tipping point.

Bond market calls Fed’s bluff.

U.S. Spending plummets.

Rising yields are now good for the markets?

IYR could still rally from here. However, with the conditions described in this post, it’s not likely.

Summary:

We’ve been short this market in a big way (not advice, not a recommendation) via DRV. The plan is to increase position size as long as price action allows low risk entries.

Charts by StockCharts

Note:  Posts on this site are for education purposes only.  They provide one firm’s insight on the markets.  Not investment advice.  See additional disclaimer here.

Active Trade: Short Biotech

The last update on the short position in biotech, said we’re keeping it until stopped out or target met.

Currently the LABD stop is located at 17.21 (not advice, not a recommendation).

The biotech IBB chart shows us price action is verifying the existence of the Neckline; The two (arrow) hits on the right side.

The deduction we’re in an H&S top, at this juncture is correct.

If IBB makes a new daily low, with LABD making a new daily high, then we’ll be able to move the LABD stop higher.

That new level will be defined by price action itself.

Stay Tuned.

Charts by StockCharts

Note:  Posts on this site are for education purposes only.  They provide one firm’s insight on the markets.  Not investment advice.  See additional disclaimer here.

Changing Hands: Bonds

The financial press is rolling out the usual suspects; bonds yields are going stratospheric and hyperinflation’s just around the corner.

A more likely view, one that’s actually based on reality, the price action itself, bonds just changed hands; from weak to strong.

Those selling or going short bonds (weak hands) at this juncture are potentially left holding the bag in a big way.

Taking a trip back in time to Livermore’s day (Reminiscences), he stated time and again, the large speculators could not enter or exit their positions at will.

They needed to have some kind of ‘event’ with heavy volume so that it would mask their moves.

It looks like we just had such an event.

The weekly chart of TLT, shows two major volume spikes. One where bonds reversed lower and now … a potential reversal to the upside.

We’re dealing with probabilities and over two-hundred years of market activity (since the Buttonwood tree).

Huge volume spikes have significance. They typically signal a pivot or the start of one.

Using that reasoning, we may have seen confirmation of rotation not only in bonds but the markets themselves; The S&P, Dow, Nasdaq are pivoting lower, with bonds and the dollar reversing higher.

Summary:

The futures market opens in a few hours. It’s typically a light-volume affair for bonds.

At times, Steven Van Meter presents in his updates how bonds have been typically slammed lower in the overnight.

That type of action has been going on for months. We’ll be looking to see if there’s a change of character.

Stay Tuned

Charts by StockCharts

Note:  Posts on this site are for education purposes only.  They provide one firm’s insight on the markets.  Not investment advice.  See additional disclaimer here.

Real Estate: Downside Targets

IYR has reversed with a decisive ‘outside-down’ week.

This sector has likely seen its highs for the year and probably its all-time (recovery) highs.

The latest news from Steven Van Metre does not paint a good picture for the economy or the markets (bonds excepted).

Jerimiah Babe (J.B.) has also posted an update on Los Angeles. It’s a human and economic tragedy. Unfortunately, this is where the Cadillac has gone off the cliff.

We’ve continually held to the stance, there’s no recovery.

The “recovery”, is a mainstream narrative intended to keep the herd focused in the wrong direction and on the wrong things.

Judging by the hysteria with small cap short squeezes, physical silver and bitcoin (kind of hard to access when the power goes out), the promulgator to the proletariat, the mainstream media, has done an excellent job.

In fact, that is their job.

Interest rates might only need to stay elevated for a short while (a few weeks) to completely choke off any semblance of economic activity.

After that, collapse is likely to feed on itself. Even if rates eventually go back lower, it’ll be too late. The juggernaut has been set in motion.

This week had IYR posting outside-down. That in turn, added a print to the P&F chart which helped to complete a downside forecast.

Reaching the target levels puts IYR below all recent support. That support would then become resistance for any upside counter-trend action.

Ultimately, we’re looking for IYR to go below 2009, lows.

If that happens, it could take months or years. P&F charts are independent of time. They only show potential.

As provided in earlier updates, my firm is positioned heavily short IYR via DRV (not advice, not a recommendation).

From here and depending on market action, the plan is to increase that short until volatility prevents further, low risk entries.

As always, anything can happen and next week could be a miracle reversal. If so, we’ll assess price action at that time.

Stay Tuned

Charts by StockCharts

Note:  Posts on this site are for education purposes only.  They provide one firm’s insight on the markets.  Not investment advice.  See additional disclaimer here.