Note: Posts on this site are for education purposes only. They provide one firm’s insight on the markets. Not investment advice. See additional disclaimer here.
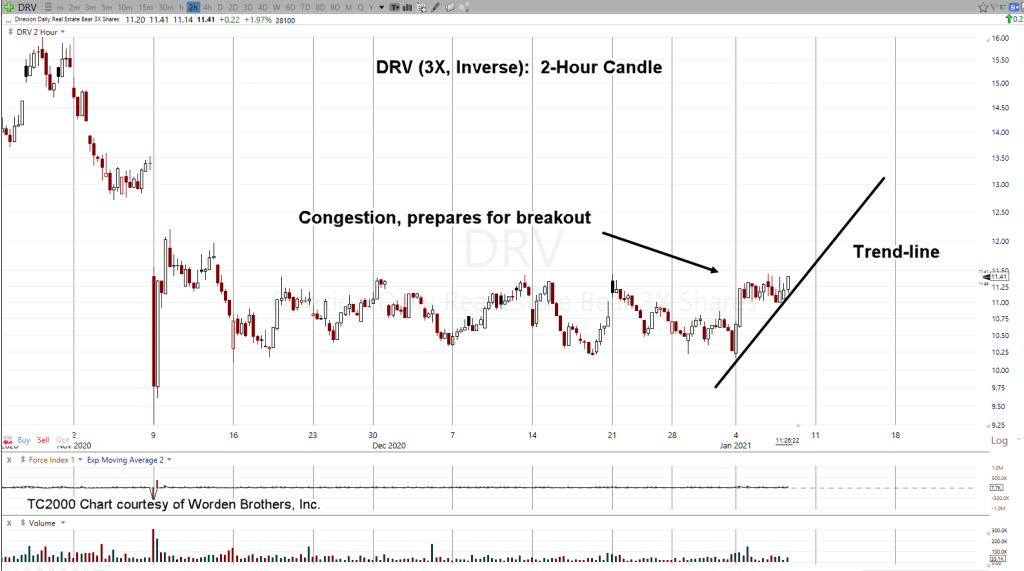
DRV is the 3X inverse tracking fund for real estate, IYR.
Price action is now breaking higher (IYR, lower).
The 2-Hour chart of DRV (above) shows the trend.
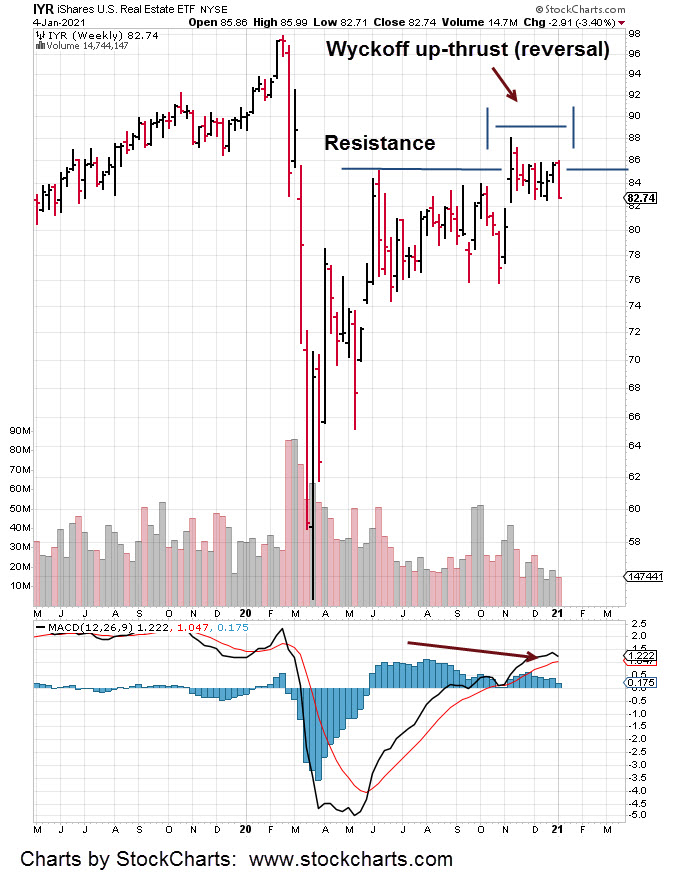
There’s always a chance price action at the trading range lows in IYR, is a potential reversal to the upside.
With the overall markets at new highs, and IYR dead-in-the-water, probabilities favor downside action (DRV higher).
Note: Posts on this site are for education purposes only. They provide one firm’s insight on the markets. Not investment advice. See additional disclaimer here.
Note: Posts on this site are for education purposes only. They provide one firm’s insight on the markets. Not investment advice. See additional disclaimer here.
Note: Posts on this site are for education purposes only. They provide one firm’s insight on the markets. Not investment advice. See additional disclaimer here.
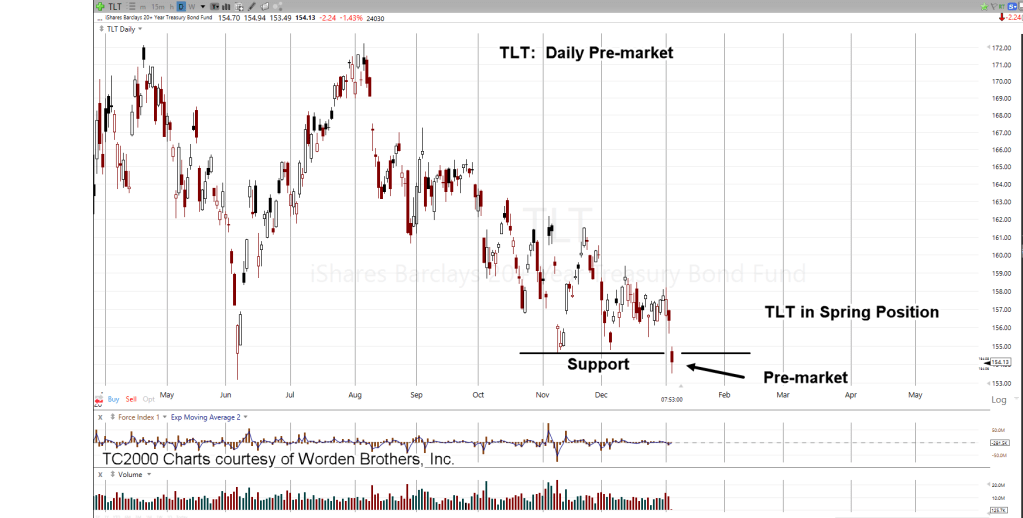
It’s busy in the pre-market and the big story is bonds.
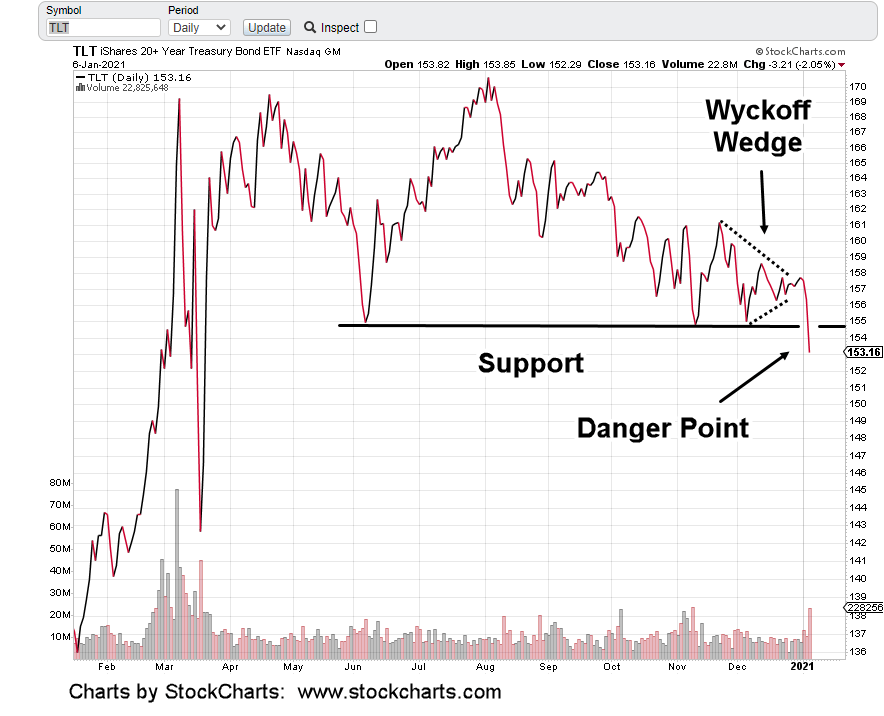
The last update, using Wyckoff as the example, said bonds would break to the upside from the wedge formation.
Sometimes before such a break, there’ll be a momentary push in the opposite direction. Then the real (reversal) move starts. That may be what’s happening now.
Looking at TLT, pre-market is trading below well-established support. If that’s where TLT opens, it may be the last gasp for the bears.
Note: Posts on this site are for education purposes only. They provide one firm’s insight on the markets. Not investment advice. See additional disclaimer here.
There’s nothing more dramatic and profitable than a failed move.
The controlling party, bulls or bears push the market in their direction; only to find out, there’re out of fuel.
The opposing side has been gathering forces to mount an offensive.
Perhaps the most famous ‘gathering of forces’ was the failure of Long Term Capital Management.
If memory serves correctly, it was Goldman Sachs that found out LTCM was over leveraged and overextended.
They used that data for their benefit.
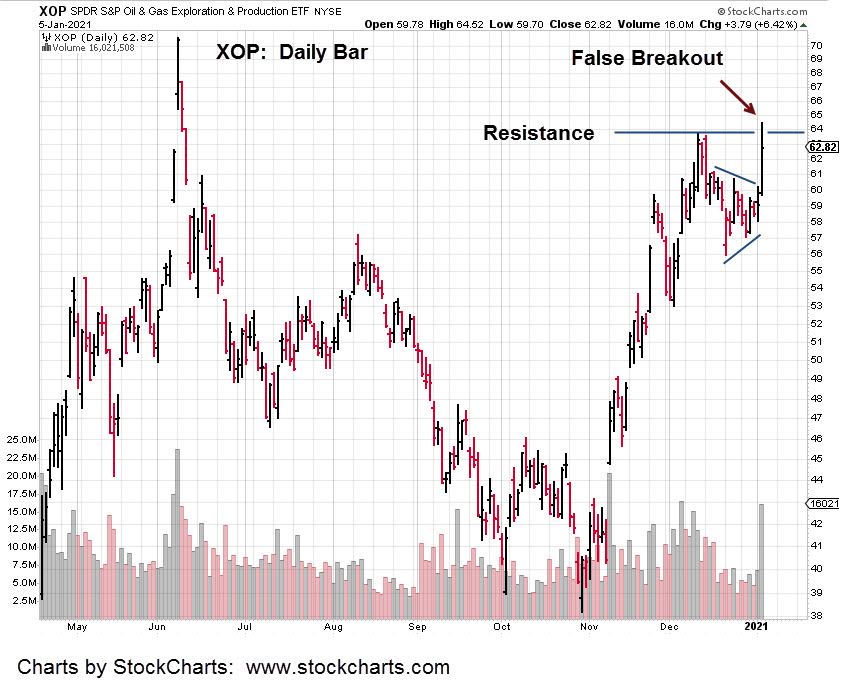
That’s not to say the failed move in the Oil & Gas Exploration (XOP) market is anywhere near the LTCM level. Just saying, markets are fractal and failed moves occur on all time frames.
The daily chart of XOP shows the failed attempt to break above resistance.
Price action was swift in the early session; then stalled at mid-day and retreated quickly into the close.
That retreat brought price below resistance … indicating significant weakness.
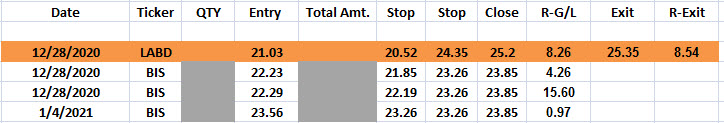
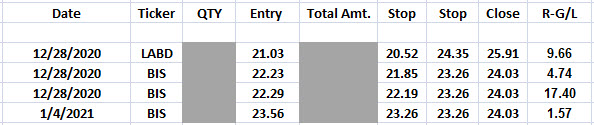
The short position in biotech (via BIS) was profitable but it did not have the potential for swift action like shorting XOP.
Since the firm follows the tenets of Gerald M. Loeb (late Vice Chairman of E.F. Hutton), we do not diversify.
Trades are focused on specific price action; therefore, tend to be concentrated only in one or two markets at any time.
We know from a fundamental standpoint, there’s no (or very little) demand for oil and the by-products. Steven Van Metre has contacts in the field that are feeding him information on what’s really going on.
While some of the minions that watch his updates complain about the colors of his moving averages, we’re more interested in the anecdotal data such as ‘oil inventories are piling up’.
Even better was the comment (a few weeks back) that EIA data is not telling the whole story. There’s even more oil than what’s in the report.
That’s our backdrop for shorting the XOP by using DUG. Not advice, not a recommendation.
Recall that DUG, with regards to the firm’s broker, has stated “not marginable” indicating especially high volatility.
Note: Posts on this site are for education purposes only. They provide one firm’s insight on the markets. Not investment advice. See additional disclaimer here.
Analysis to follow. Not advice, not a recommendation
Note: Posts on this site are for education purposes only. They provide one firm’s insight on the markets. Not investment advice. See additional disclaimer here.
Note: Posts on this site are for education purposes only. They provide one firm’s insight on the markets. Not investment advice. See additional disclaimer here.
Note: Posts on this site are for education purposes only. They provide one firm’s insight on the markets. Not investment advice. See additional disclaimer here.
About a year after Teddy Roosevelt left office, Wyckoff published his seminal work; Studies in Tape Reading. That year, was 1910.
Wyckoff was the one that defined support, resistance, accumulation and distribution.
He was the one that discovered markets have a power of their own; having nothing to do with any fundamentals.
Wyckoff found that if you can decipher price action, you can determine the most probable direction.
A first edition Wyckoff ‘Tape Reading’ text … if you can find it, goes for about $3,500.
Even lesser known books of Wyckoff such as this one, go for hefty sums.
In his ‘Tape Reading’ text, on page 102, he shows a diagram that represents price action exhaustion.
His discussion (repeated below) is concerning the bull side.
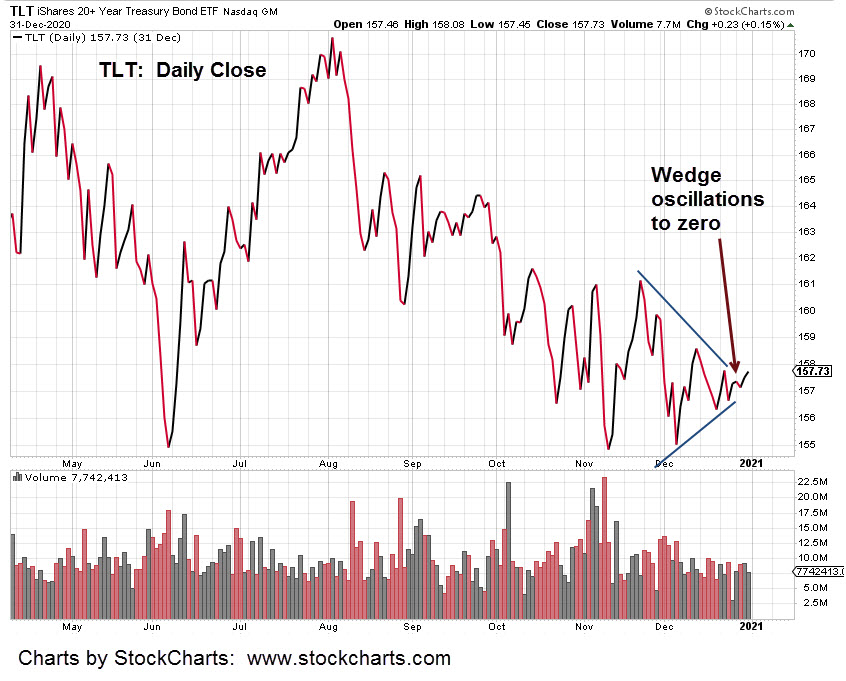
For today’s chart of TLT, we’ll mentally swap every ‘bull’ notation from Wyckoff with ‘bear’ and conversely, every ‘top’ notation with ‘bottom’, every ‘buy’ notation with ‘sell’ and so on.
“ … and you see what the chart of a stock or the market looks like when it reaches a point of dullness.
These dull periods often occur after a season of delirious activity on the bull side. People make money, pyramid on their profits and glut themselves with stocks at the top. As everyone is loaded up, there is comparatively no one left to buy and the break which inevitability follows would happen if there were no bears, no bad news or anything else to force a decline.”
The ‘dull’ period he is discussing is shown below in TLT. It has repeated the diagram on his page 102, in near identical fashion.
We have supplementary evidence from Steven Van Metre during this report, the bond bears have started to back off their historic short positions.
They are trapped and exhausted; all their selling has not collapsed bonds as anticipated.
So, let’s see what happens next. According to a text written 110-years ago, we are expecting a rally in bonds .. a massive rally.
Note: Posts on this site are for education purposes only. They provide one firm’s insight on the markets. Not investment advice. See additional disclaimer here.