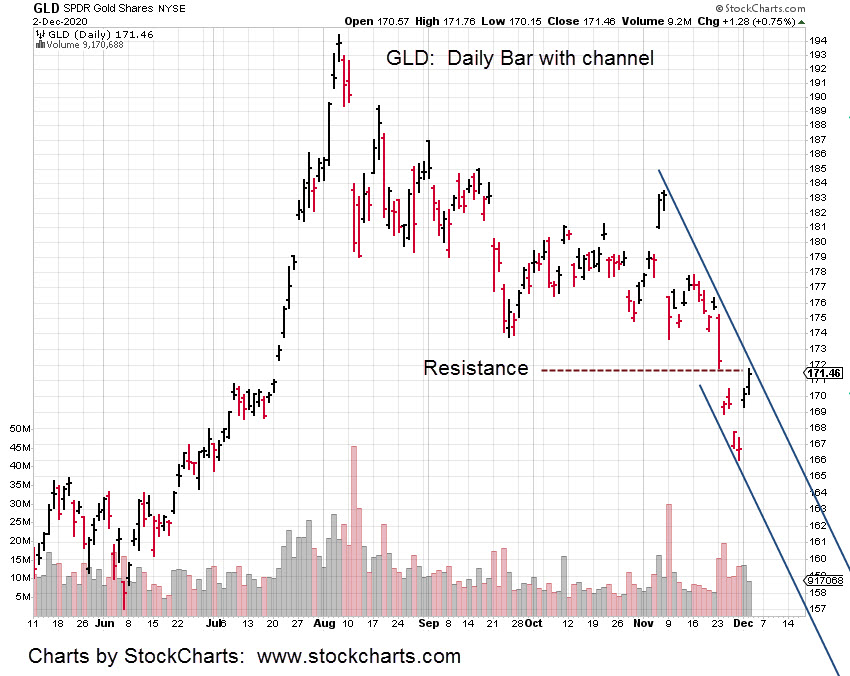
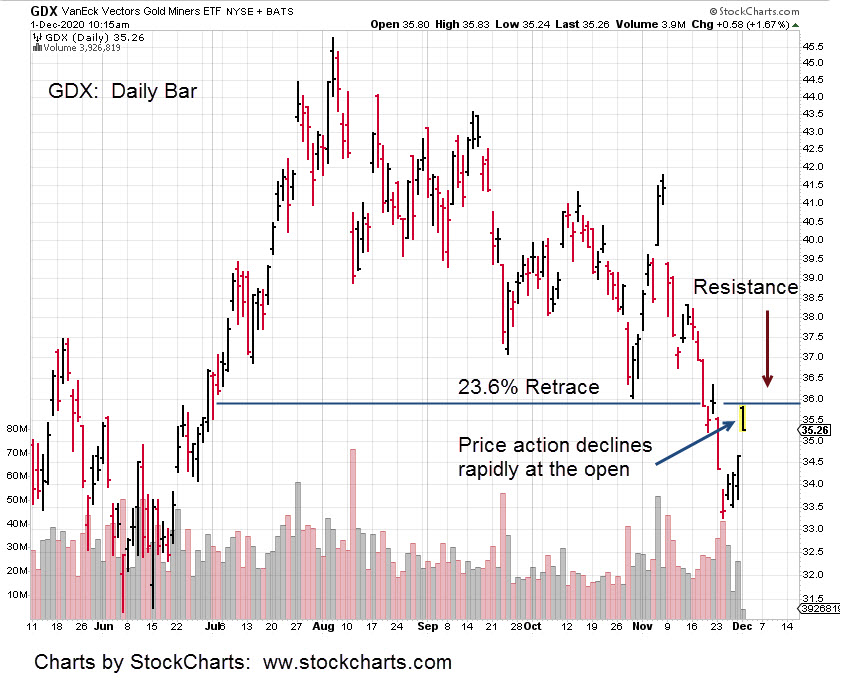
October 1987, Is That You?

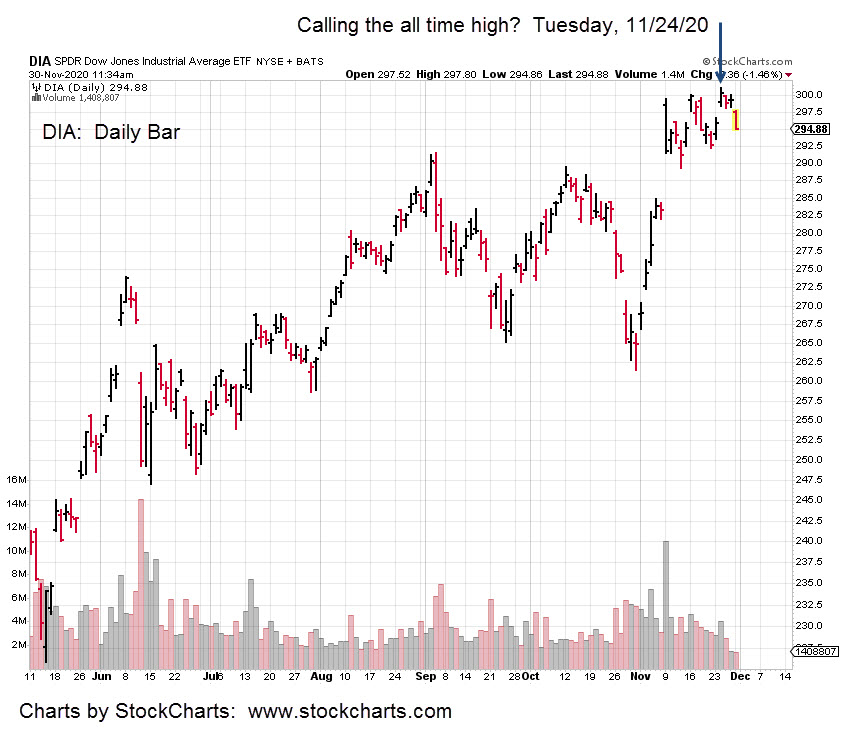
Price action has an eerie similarity to August 1987 and the months following.

To those old enough … recall how prices just seemed to press higher and higher during the summer months?  Stretched, they were.

Then came a break with a move lower.  After a while, a few weeks or so, it seemed as if the market was going to make another attempt.

The second attempt did not seem as energetic.  Prices continued on though … until they stalled and headed lower.

Just like now?

Continuing on with 1987, price action drifted on down; seemingly with out much fanfare until one day … a Friday there was a huge drop.

That was Friday, October 16, 1987.  We all know the action that followed on Monday.

Getting back to the markets at hand:

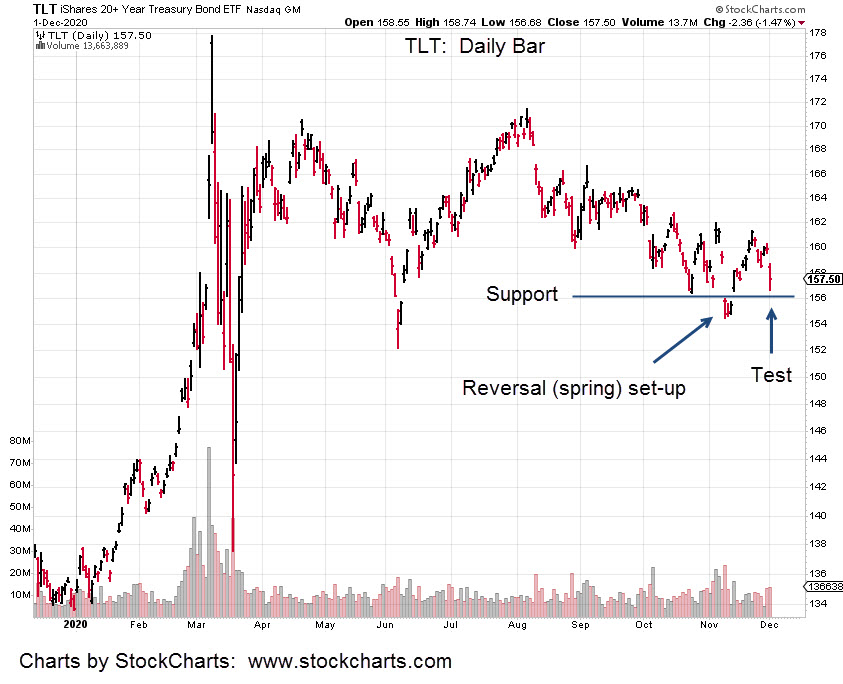
The last bond update showed a potential bullish set-up. 

There’s nothing that says bonds can’t start higher now.  In fact, it’s been two up days in a row for TLT.

If TLT penetrates the 160.98, level to the up-side, it’s a classical analysis (not a recommendation, not advice) buy signal on the weekly time-frame.

As of this post (7:01 p.m. EST), the S&P futures are already down -22 points, or about -.65%.  Correspondingly, bonds are higher.       

Charts by StockCharts

Note:  Posts on this site are for education purposes only.  They provide one firm’s insight on the markets.  Not investment advice.  See additional disclaimer here.

Biotech In Position

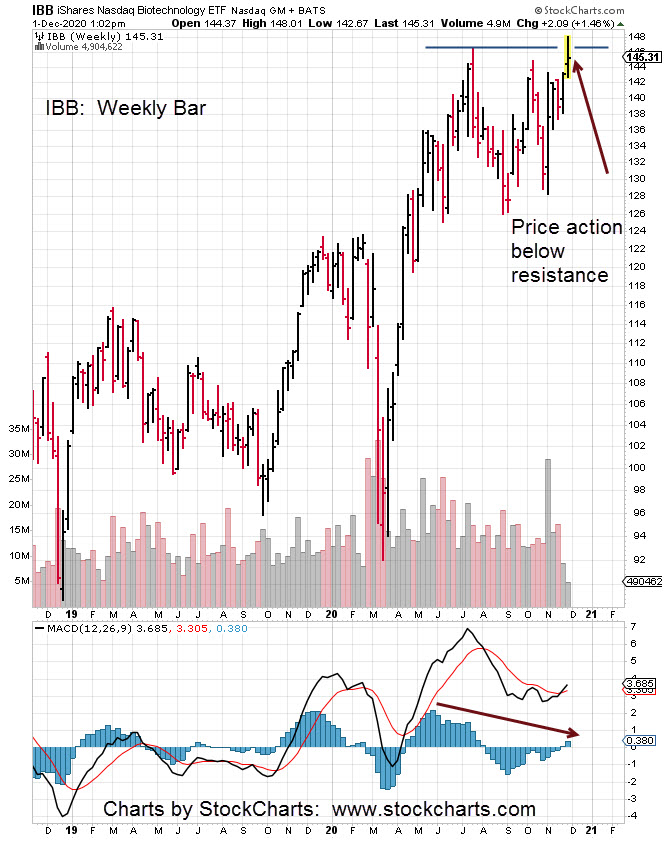
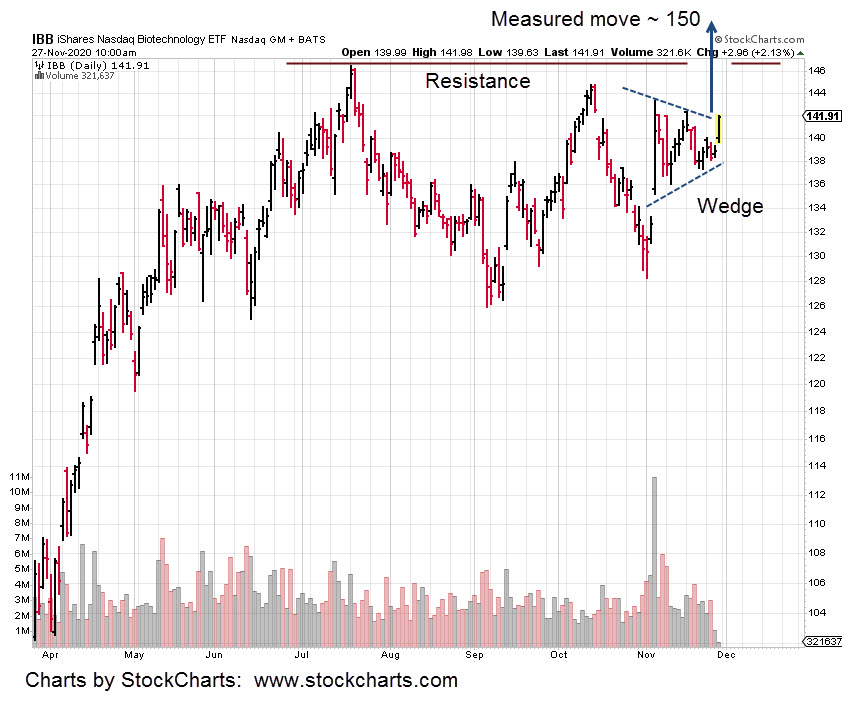
Biotech (IBB) is now in position to move higher as a test of the trend break from Monday, the 19th.

The chart shows IBB has retraced 68% of the move from the September 4th low, to the October 14th high.

That’s a deep pull-back and suggests weakness. 

However, after a trend-line break, it’s typical market behavior to mount some kind of rally to test the break.

If that happens, part of the test could be a new high. 

We already have a weekly MACD divergence (possible). If the test occurs soon enough, there could be a daily divergence as well.

Weekly and Daily bearish divergences. We’ll see.

Charts by StockCharts

Note:  Posts on this site are for education purposes only.  They provide one firm’s insight on the markets.  Not investment advice.  See additional disclaimer here.

Newmont Hits Trend, Heads Lower

It’s about two hours after the open.

Newmont (NEM) has already tested upward into its trend-line.

Then, it reversed and makes a new daily low.

Not good for the bullish case.

The daily chart shows three hits on the right side line as well as a possible trading channel.

It seems hard to believe. It looks like NEM has seen its highs for the year and possibly much longer.

As always, anything can happen.  It’s still very early in the session and there could be a reversal … although a low probability.

Stay tuned.

Charts by StockCharts

Note:  Posts on this site are for education purposes only.  They provide one firm’s insight on the markets.  Not investment advice.  See additional disclaimer here.

What’s wrong with this picture?

The good part about price danger points, price action does not need to go far to confirm or negate the trade.

We’re at that point now with precious metals and more specifically, the junior mining sector, GDXJ.

A brief search for YouTube “gold higher”, turns up the list below. 

The amount of bullish biased videos is easy to find. 

Everybody’s doing it.

Gold To Explode

Embrace The Dip

Growing Debt, Gold higher

Ray Dalio, Gold Price Up

Expect $2,500 Gold Price

Peter Grandich, 100% In On Mining Stocks

Silver Price Will See Explosion

Silver, Time To Buy is Now

How High Will Silver Go?

$36 Silver By End Of 2020

Who wants to hear that a favorite investment or market is heading lower?  

Getting to the chart of GDXJ and what’s wrong; it’s obvious.  

There’s a huge non-confirmation.  

The gold tracking fund, GLD is back at or near all time highs and yet GDXJ (the junior sector), is down -58.8%.

There is no way to paint this in a positive light.  Down nearly 60% is massive. 

One way to look at it is, the junior sector does not believe gold (and silver) prices can be sustained at current levels.

Or, if they are sustained, there must be something else at work that would prevent them form obtaining a substantial profit.

Either way, the last report on the sector stepped through the current price action.  We’re at the danger point for GDXJ.

A move higher in the coming week will put a dent in (or negate) the bearish scenario and a move lower will help to confirm.

Stay tuned

Charts by StockCharts

Note:  Posts on this site are for education purposes only.  They provide one firm’s insight on the markets.  Not investment advice.  See additional disclaimer here.

Long Bond Short: Largest, Ever

Charts by StockCharts

Note:  Posts on this site are for education purposes only.  They provide one firm’s insight on the markets.  Not investment advice.  See additional disclaimer here.

Newmont: Wedge Breakout

The entire precious metals sector may be about to take an unexpected hit.

Prior updates have discussed the Newmont (NEM) bearish divergence and reversal.  This update shows a rising wedge breakout to the downside.

Using standard analysis techniques on the chart below, we get a measured move to the vicinity of 47 for NEM.

A decline of that magnitude, a drop of over 22%, may be the catalyst for a whole other bearish scenario.

Just based on empirical observation and analysis generally available (YouTube, et al), it’s pretty safe to say that no-one is prepared for a significant decline.

Well, almost no-one.  As reported back in late September, the only YouTube analyst (that was located) proposing the idea of a decline was Sajad, in this report.

Charts by StockCharts

Note:  Posts on this site are for education purposes only.  They provide one firm’s insight on the markets.  Not investment advice.  See additional disclaimer here.

EIA Report: Tight Supplies

The EIA report write up says that natural gas inventories are tight.

For your reading enjoyment, there’s a quote saying to the effect; ‘we do not anticipate a cold winter’.

Well, getting back to the front line of what’s really happening; even now in October, there’s already record cold in Cheyenne

Let’s see what happens next. 

As of this post, 12:58 p.m. EST, UNG is moving higher (at UNG 12.58) and off the lows of the day.

Charts by StockCharts

Note:  Posts on this site are for education purposes only.  They provide one firm’s insight on the markets.  Not investment advice.  See additional disclaimer here.

Step by Step: Shorting GDXJ

Charts by StockCharts

Note:  Posts on this site are for education purposes only.  They provide one firm’s insight on the markets.  Not investment advice.  See additional disclaimer here.

Fail: Gold Miner Indexes

When in an uptrend and prices start to flag, it’s a warning that energy is lost.

The Newmont update showed the heavy hitter was in a reversal.  That update gave specifics on how or when the reversal would be negated (and back into an uptrend).

It’s not happening. The upside hasn’t showed … or, at least not yet.

The next trading day, Newmont (NEM) lost 1.5%. The day after that (yesterday), was another down day with a loss of nearly 1%.

Today, NEM is attempting to move higher. However, the weekly bar is still in reversal.

The mining indexes themselves are not so clear.  The junior index with its weekly chart below, has it reversing last week and now attempting to move higher.

It’s losing steam.  It’s no secret that failed moves can be the most dynamic of all price action.

The market is ‘supposed’ to go one way … in the case of the silver/gold miner’s, they’re supposed to be moving higher; Hyperinflation and everything, right?

What if everyone’s on the wrong side of the trade?

What if the expected hyperinflation is years away? 

This juncture right now, appears (not advice, not a recommendation) to be a low risk area to go short.

In the case of the junior index GDXJ, if price action closes up for the week, the bull market may continue.

If not, and GDXJ closes down for the week, the up-trend looks like it’s failing and the entire sector could fall apart.

Charts by StockCharts

Note:  Posts on this site are for education purposes only.  They provide one firm’s insight on the markets.  Not investment advice.  See additional disclaimer here.

Nat-Gas: Trend Contact

Nat-gas, UNG contacts its trend-line on a low volume day.

The daily chart is modified to show pre-market activity. It has UNG posting a low of 10.66, about one hour before the regular session, October 2nd.

With that low, we can see three trend line contact points … which includes today’s contact.

The expectation is for nat-gas to inflect upward at this point and continue higher as we head into the fall and winter months.

Charts by StockCharts

Note:  Posts on this site are for education purposes only.  They provide one firm’s insight on the markets.  Not investment advice.  See additional disclaimer here.