S&P 500: Downside Target

If the analysis is correct and the S&P’s completing a terminating wedge, then we have a downside target.

The measured move is around 330 – 333. Reaching that level would put the SPY down about 16% from all-time highs.

If that happens, expect the usual suspects (the financial press) to say, ‘well, a bear market is 20% or more … so we’re good’.

Let’s see how that works out.

Charts by StockCharts

Note:  Posts on this site are for education purposes only.  They provide one firm’s insight on the markets.  Not investment advice.  See additional disclaimer here.

Amgen (AMGN) Breaking Lower

Amgen’s the largest cap in the biotech sector ETF, IBB.

Loss of momentum (magenta arrow) is clear.

Upside energy (weekly) MACD has been dissipating for over a year.

So, this is no transient direction change. Zooming into the daily chart shows hesitation at the trend line.

Then last Friday, a significant move away from that trend.

When there’s a trend break, typically there’ll be a test of that break.

In this case, such a test would cause price action to move higher; testing the underside of the trend.

Because there’s been so much congestion at the trend line, we may not get the upside move.

It may have already self-tested. From here, price action could just make its way down to the measured move target ~ 164 – 165.

Positioning:

We’re short this market via LABD (not advice, not a recommendation) and have moved the stop to 18.17, based on yesterday’s action.

Summary:

If AMGN decides to test the trend underside, it’s likely to stop out LABD.

If price continues to decline (unabated) to target levels, we’ll probably exit at pre-identified IBB, target ~ 138 – 140 (approx: 35 – 38, LABD).

Stay Tuned

Charts by StockCharts

Note:  Posts on this site are for education purposes only.  They provide one firm’s insight on the markets.  Not investment advice.  See additional disclaimer here.

Real Estate: Off The Chart

New downside targets for IYR are literally, ‘off the chart’.

There’s a good deal of support in the 84 – 86 area. So, price action hesitation is to be expected.

However, technicals and fundamentals have aligned themselves. Conditions are now in place for a persistent, sustained decline.

Charts by StockCharts

Note:  Posts on this site are for education purposes only.  They provide one firm’s insight on the markets.  Not investment advice.  See additional disclaimer here.

Failed Rally Attempt: Real Estate

Nothing gets sharks in the water faster, than a failed move.

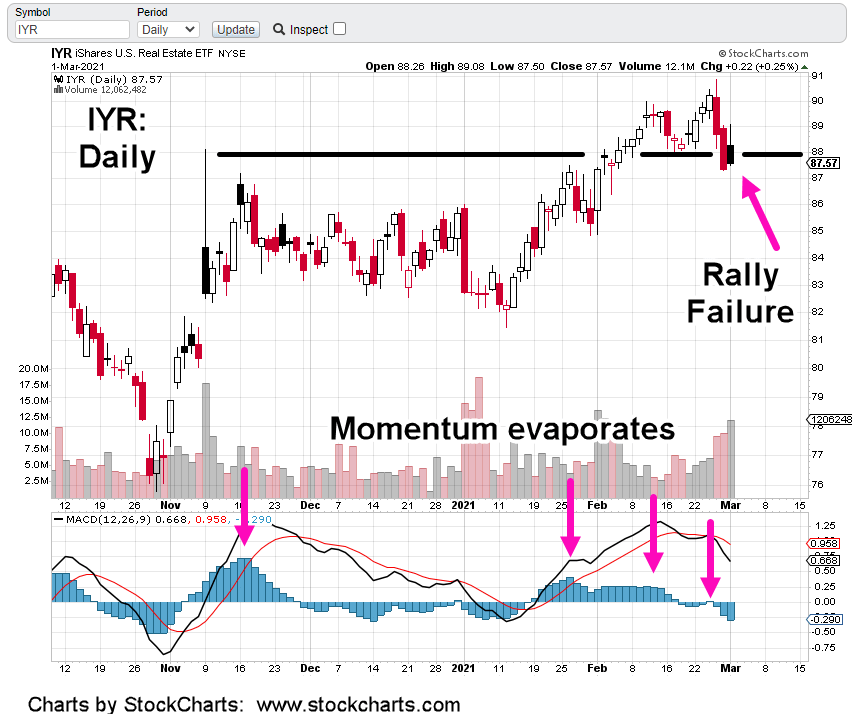
Last Friday, real estate IYR closed below support (black line). Doing so, put itself in Wyckoff spring position.

‘Spring position’ is a technical condition of instability where price can reverse dramatically.

At the open yesterday, that’s exactly what happened. IYR launched nearly instantly to a 50% retrace.

From there it was a long day of moderate price erosion all the way to the last hour; then it all went south.

IYR closed just 0.22 points higher or +0.25%, after being as high as +1.73 points (+1.98%), early in the session. In addition, that close was back below support on the heaviest volume since February 2nd. … another bearish sign.

We can see momentum, MACD has exhausted itself and posted numerous bearish divergences.

On the fundamental side, just in the past 24-hours, there’s been a raft of news articles posted showing commercial real estate’s in serious trouble.

A short list of what has been found is below:

Mortgage market.

Mall values crash.

Bond tipping point.

Bond market calls Fed’s bluff.

U.S. Spending plummets.

Rising yields are now good for the markets?

IYR could still rally from here. However, with the conditions described in this post, it’s not likely.

Summary:

We’ve been short this market in a big way (not advice, not a recommendation) via DRV. The plan is to increase position size as long as price action allows low risk entries.

Charts by StockCharts

Note:  Posts on this site are for education purposes only.  They provide one firm’s insight on the markets.  Not investment advice.  See additional disclaimer here.

Active Trade: Short Biotech

The last update on the short position in biotech, said we’re keeping it until stopped out or target met.

Currently the LABD stop is located at 17.21 (not advice, not a recommendation).

The biotech IBB chart shows us price action is verifying the existence of the Neckline; The two (arrow) hits on the right side.

The deduction we’re in an H&S top, at this juncture is correct.

If IBB makes a new daily low, with LABD making a new daily high, then we’ll be able to move the LABD stop higher.

That new level will be defined by price action itself.

Stay Tuned.

Charts by StockCharts

Note:  Posts on this site are for education purposes only.  They provide one firm’s insight on the markets.  Not investment advice.  See additional disclaimer here.