Note: Posts on this site are for education purposes only. They provide one firm’s insight on the markets. Not investment advice. See additional disclaimer here.
First: Those late to shorting the Emerging Markets (EEM) are going to get whacked.
Second: Those shorts properly positioned, are going to take a hit but will have an excellent opportunity to move stops after the smoke clears.
Not addressed, are those who think this is an opportunity to go long.
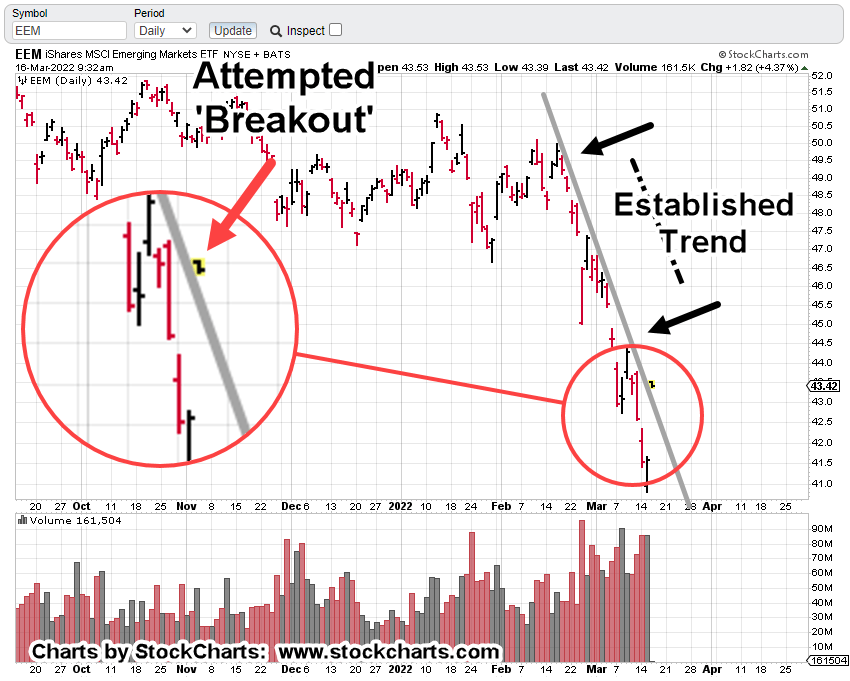
It’s about 25-minutes after the open. The daily chart of EEM, below shows current action.
Emerging Markets, EEM Daily
It’s clear that price action is attempting to break through the trend.
This type of action is typical bear market behavior.
Bear markets are all about price destruction along with an overall downward direction.
The market’s objective is to make sure as many as possible are thrown off the main trend (stopped out, busted out) and not able to participate.
Summary
If the downtrend is still in-effect, EEM price action will stall and then ‘hurry itself’ to get back into the trend … after the shorts have been cleared out.
That short clearing could be just hours or even days.
At this juncture, the current stop for EDZ-22-01, remains at 11.96, as detailed in this post (not advice, not a recommendation).
Update: 10:32 a.m., EST. Position stopped out at 11.96 and posted an overall gain of 8.33%
Note: Posts on this site are for education purposes only. They provide one firm’s insight on the markets. Not investment advice. See additional disclaimer here.
The narrative and the price don’t agree; at least at this point.
Over and again, we hear it’s ‘dollar destruction’ and ‘hyperinflation’.
Here is a link to one of the latest pontifications on what ‘inflation’ is doing or is going to do.
After watching that, one is so much better informed. Well, at least we know what the bit-players are saying … each reading from their own (pre-approved) script.
Let’s get back to reality and the price action at hand.
We’ll start with this quote from the last update which references shorting the gold miners using JDST (not advice, not a recommendation).
“However, something that can be done is to use that upward bias to position short at the lowest risk possible.”
That’s exactly what was done during this (past) session; let’s start first with the big picture.
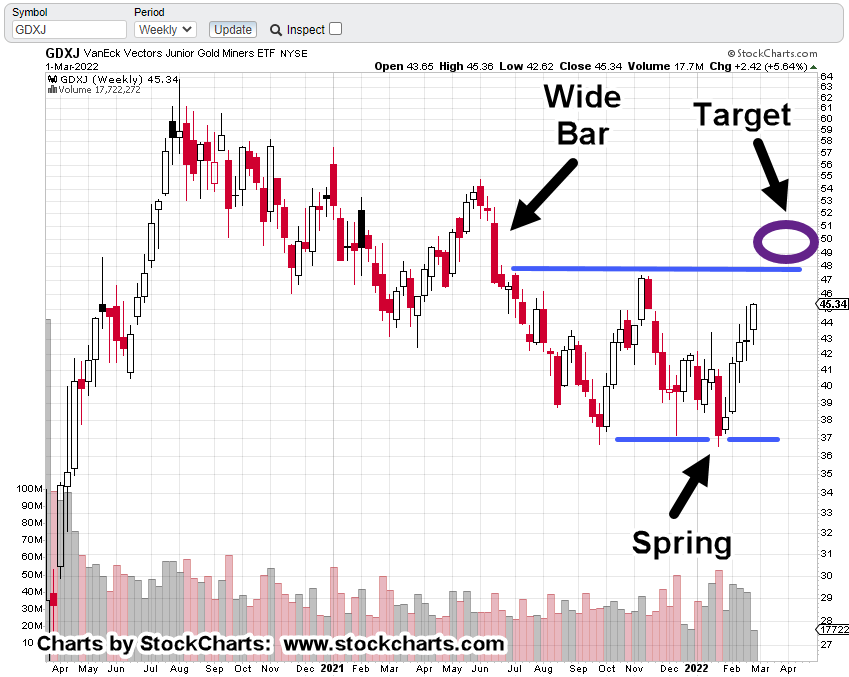
Junior Miners GDXJ, Weekly
As a reminder, and for those who may be new, we’re looking for a particular price pattern that has been shown to repeat over time:
Note: Posts on this site are for education purposes only. They provide one firm’s insight on the markets. Not investment advice. See additional disclaimer here.
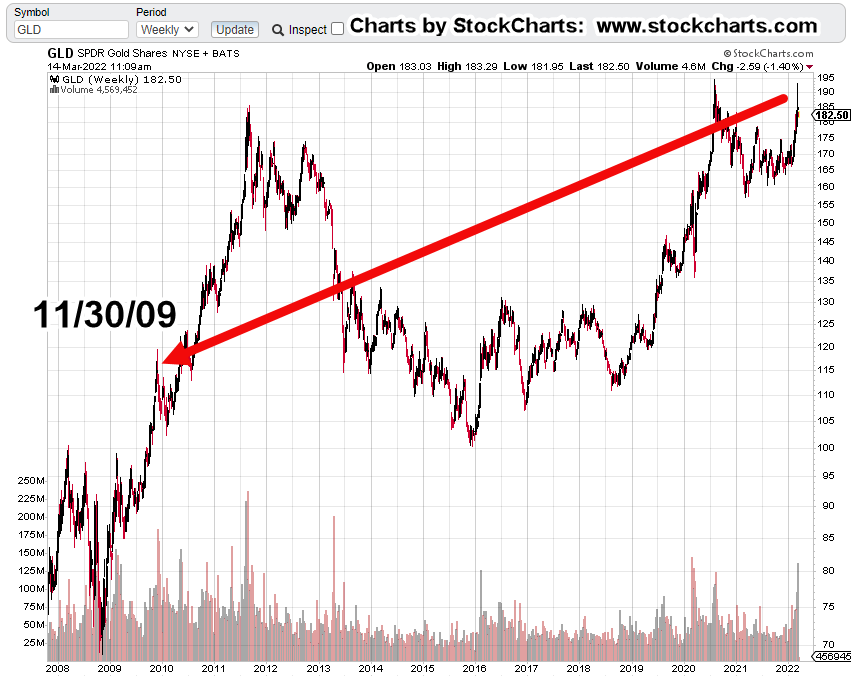
All the way back to late November 2009, to find a bar that’s remotely similar to the one just posted last week.
Even then, there are key differences.
The reversal during the week of November 30th, 2009 was after a breakout and run-up of about 20%; from the resistance/support area around GLD, @ 100.
Last week’s bar was within a trading range not outside it. Also, we had to wait until this morning’s open to get a new weekly low.
Volume (blow-off) characteristics were similar:
Week-ending 11/30/09, volume 93% higher than the week before; week-ending 3/11/22, volume 43% higher than the week before.
GLD, Weekly Chart
The chart gives us a feel for just how far back we have to go to find similar price action.
The prior update said at this juncture, longer term momentum indicators are pointing higher. Thus, suggesting there will be some kind of upward test either today or this week (Fed meeting?).
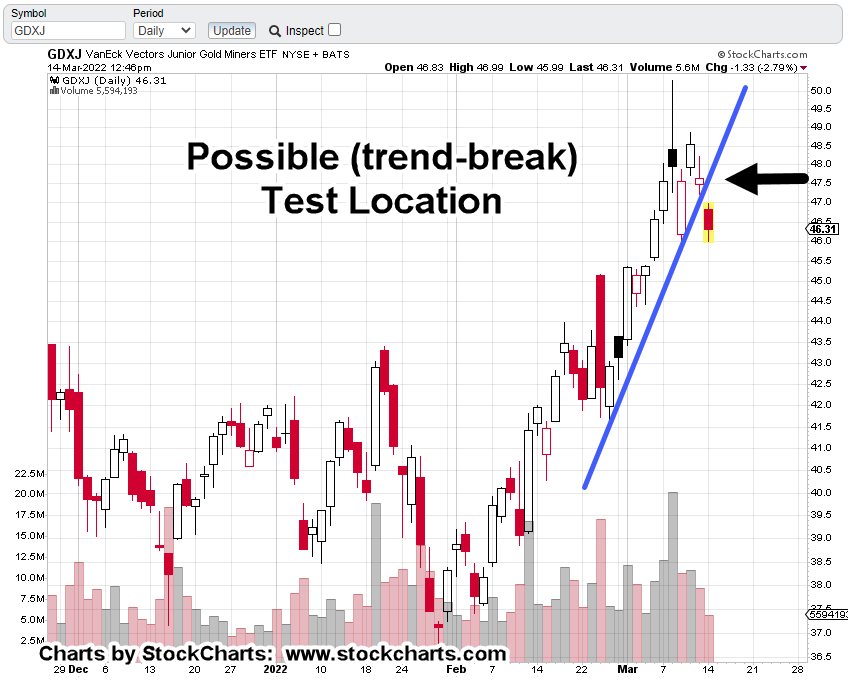
Junior Miners GDXJ, Weekly
Earlier this month, this post said to expect GDXJ, to up-thrust in the 48 – 50, area.
That does not guarantee a downside reversal. It just shows us price action repeats these behaviors; doing so for decades, if not hundreds of years.
What happens now?
Longer term momentum indicators point higher and give the bias to the upside.
However, something that can be done is to use that upward bias to position short at the lowest risk possible (not advice, not a recommendation).
Positioning via JDST
Junior Miners GDXJ, could come back to test the trendline break shown below starting today, through Wednesday.
If it does, the difference between being correct (about going short) and continued bull side action may be narrowed as much as possible (not advice, not a recommendation).
If that happens, the JDST stop will be very tight.
Note: Posts on this site are for education purposes only. They provide one firm’s insight on the markets. Not investment advice. See additional disclaimer here.
“The truth is incontrovertible. Malice may attack it, ignorance may deride it, but in the end, there it is.”
Winston Churchill
No matter what one may think about Churchill, the truth at this juncture for gold (GLD), is an island gap reversal:
‘There it is’
Longer term momentum indicators, MACD, are pointing higher on both the monthly and weekly.
So, there’s definitely some upward bias.
The ‘Next’ Catalyst
We’ve already had military attack, bombing of a nuclear power plant (so they say) including the actual threat of nuclear detonation … so what’s next?
The (fake) alien invasion?
What if aliens really do invade? My first thought of course will be, “I’m glad I have my stack of gold and silver to get me through. I feel much better.”
No, let’s get real.
We’re all going to wish we had a ‘Ma Deuce’, like this one.
If you’ve got one of those, you can have all the gold and silver you want … plus a few aliens to boot. 🙂
Hyperinflation, Here, Now?
Well, there’s at least one way to tell and that’s by the price action itself.
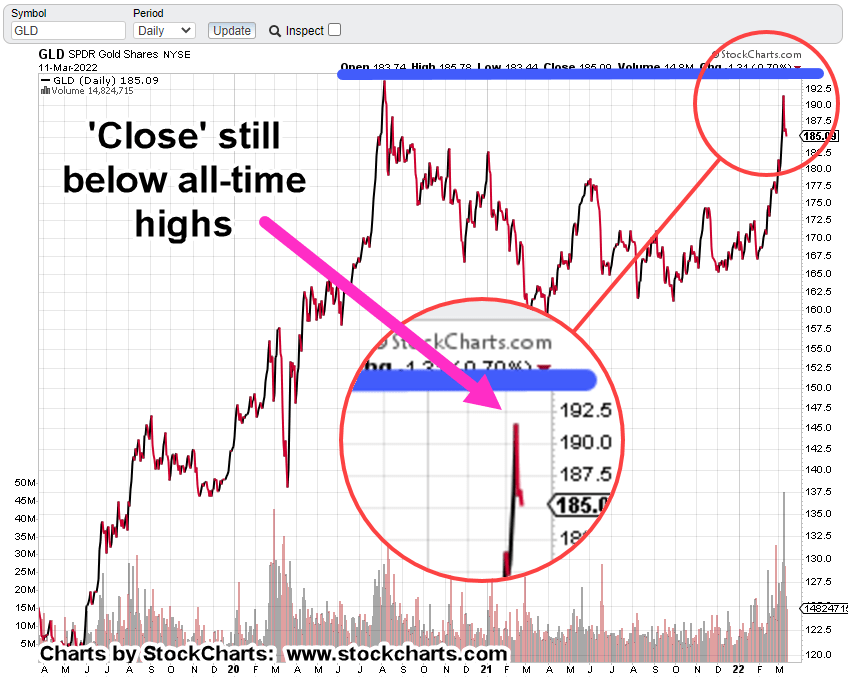
The daily chart of gold tracking fund GLD below, clearly shows the island gap.
Even with all the upward bias on longer-term momentum (MACD) indicators, if GLD can’t fill that gap, there’s something else at work.
On a closing basis, GLD is still below all-time highs, set back on August 6th, 2020.
With the climactic volume and price spike discussed previously, short term expectations are for some type of (continued) downward retrace.
Then, There’s This
It’s still about four hours to go before the Sunday futures open and anything can happen.
Note: Posts on this site are for education purposes only. They provide one firm’s insight on the markets. Not investment advice. See additional disclaimer here.
Taiwan Semi (TSM) is the largest cap in the Emerging Markets, EEM (ETF) Index.
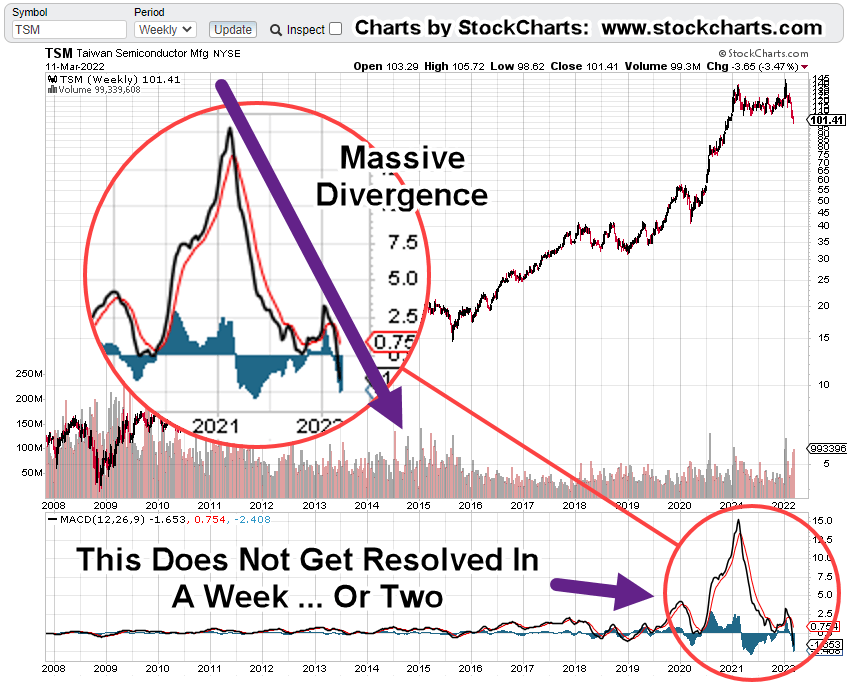
As we’ll see from a technical standpoint, TSM’s posted a massive bearish divergence.
That divergence is now being confirmed with price action breaking lower.
As shown below, price action’s launch from a low of 5.83, in November 2008, to a high of 145.00, on January 13th, this year, has been stratospheric; over 2,595%.
However, for about eleven months, the last part of that action was sideways. Then, a Wyckoff up-thrust during the middle of January and reversal lower.
That’s where we are now.
Taiwan Semi (TSM) Weekly Chart
Highlighting the divergence.
The problem or the benefit (depending on long/short), such reversals take much longer to play-out, than anyone expects.
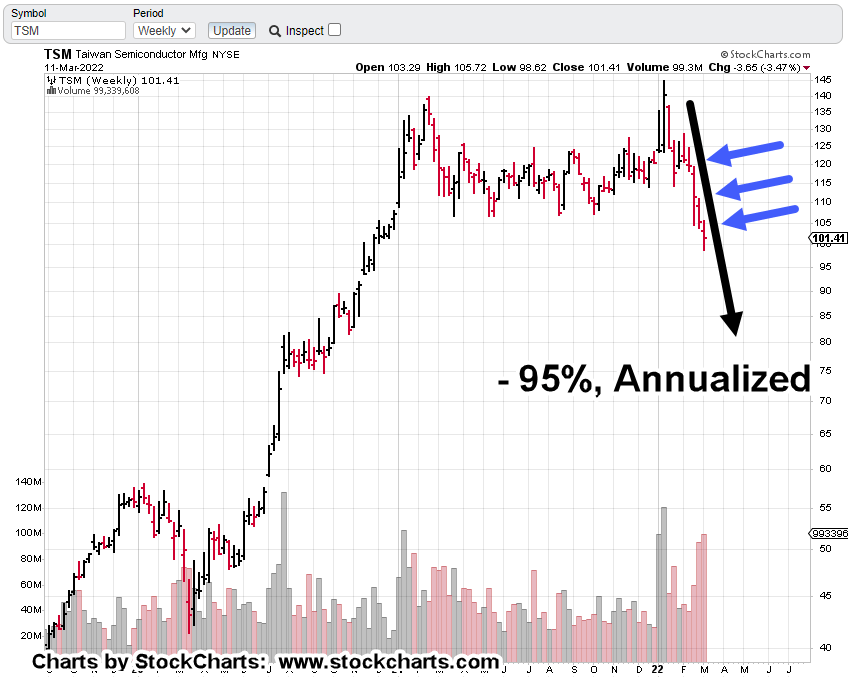
Moving closer in, on the weekly.
At this juncture, TSM’s following a trendline lower that’s declining at approximately – 95%, annualized.
Volume for the week increased from the week prior, which increased from the week before that, also increasing from the week before.
Downward pressure continues; TSM’s down -30%, from its all-time highs.
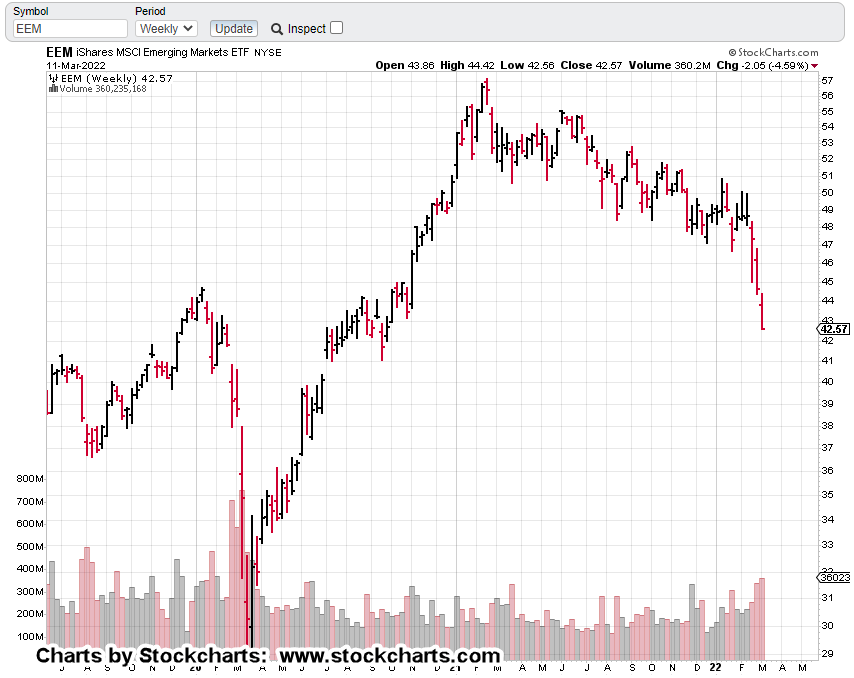
Emerging Markets, EEM
When looking at the weekly chart of EEM, we can see the downward effect of TSM on this index.
Drilling down into the daily chart of leveraged inverse fund EDZ and compressing the vertical scale, one gets a sense for the potential of this move.
EDZ Daily (vert. scale compressed)
As a courtesy, entry dates, prices and current stop are listed (not advice, not a recommendation).
TSM & EEM, (EDZ-22-01) Targets
Coming up in another update, more specific (Fibonacci) targets for potential exit of the EEM short via EDZ.
At this juncture, an obvious (capital preservation) exit would be decisive penetration of the trendline shown or hitting the current stop; not advice, not a recommendation.
Summary
One of the hardest things to do for amateur and professional alike, is nothing.
That may be where we are with TSM, EEM and EDZ. The short position has been opened; stops and trend identified.
Now, the waiting.
As Livermore said nearly a century ago, it’s the waiting (not the thinking) that made him the money.
Note: Posts on this site are for education purposes only. They provide one firm’s insight on the markets. Not investment advice. See additional disclaimer here.
One hour, and fifteen minutes after this post was released, gold and the miners topped-out.
Depending on the close for today, gold futures prices may post a weekly reversal bar.
If it happens, that’s an important nuance.
The prior reversal from all-time highs … back in early August of 2020, did not happen on weekly reversal bar or even a daily bar.
What does that mean or what could it mean?
Unlike last time where gold (GLD), hovered around its all-time highs for a couple of weeks, this time, it looks like it can’t even do that.
We’re at the danger point.
For the gold tracking fund GLD, the price to watch is Monday’s open at 184.45. Closing below that level, indicates trouble for the bulls.
Gold (GLD), Daily Chart
Twelve months of daily price action shows the build-up, to the blow-off.
Below, we have a ‘measured move’ target completed.
Then, we have a volume climax.
Changing of hands from strong to weak.
Such volume spikes typically indicate the potential for a long-term, sustained reversal.
Contrary View
This analysis isn’t contrary just to be contrary.
We’re looking for market truth. Meaning, ‘what’s the market saying about itself?’
Once that truth is found or at least probabilities identified, then it’s incorporated into a strategic plan.
Go-Forward Strategy
At this point, it’s more than obvious, food and the food supply, is literally going to be the choke-point.
As nations world-wide, scramble to secure reliable food sources, anything can happen. They can even resort to selling-off their gold reserves en-masse, to pay for the insane commodity prices.
Don’t think that can happen?
Well, oil futures couldn’t go negative either, right? Nickel couldn’t surge to record highs on the largest single-day jump ever, right?
London Metal Exchange (LME) would never cancel trades and fudge their numbers, right?
What couldn’t happen then, is likely to happen now.
There’s a chance gold will not post a weekly reversal at the end of this session (currently, 12:53 p.m., EST). If so, it holds open the probability for an upward test or series of tests in the coming week.
Note: Posts on this site are for education purposes only. They provide one firm’s insight on the markets. Not investment advice. See additional disclaimer here.
This post, highlighted the reasoning for a sustainable breakdown in the Emerging Markets, EEM.
The leveraged inverse vehicle for that index is EDZ.
Up until about two weeks ago, that fund was a low volume wall-flower.
That’s all changed … at least, for now.
The ten-day trading period from February 1st to 14th, had average EDZ, volume of 251,000 shares/daily.
Fast-forward, ten days from February 24th, to today, March 9th; average volume is up over 280%, at 955,000 shares/daily.
EEM Weekly Chart
The weekly chart’s orderly lower-trending price action broke to the downside during the week of February 25th.
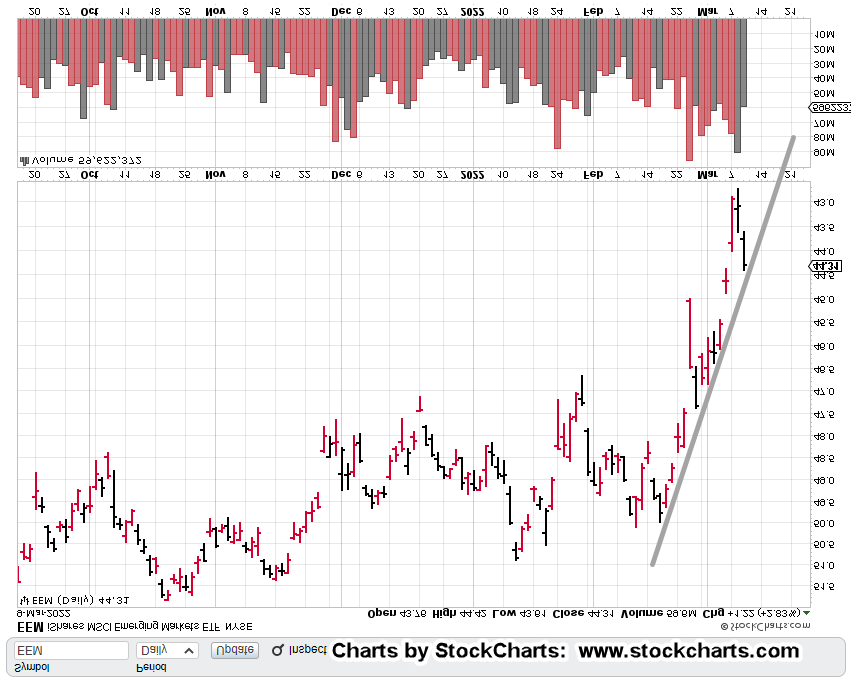
Inverting the chart and noting the apparent trend-line shows this week’s action is closing the breakout gap and testing the trendline.
Closer-in on the (inverted) daily shows just how many hits there are on this trend; looks like about eight so far which includes today, March 9th.
Positioning
This earlier post showed how I worked the sector via inverse EDZ (not advice, not a recommendation).
Depending on tomorrow’s price action, today may have been another low-risk opportunity for entry.
If EDZ makes a new daily high at the next session, the stop, identified previously (EDZ: 10.90) will be moved up to 11.96 (not advice, not a recommendation).
Opinion
This article says, ‘limit down‘ is coming; the opening market drop will be so large, it’ll be ‘limit down’, not allowing sells (for a set time period).
If that happens, the next day is likely to be the same and the next after that.
This is how fortunes are made and destroyed.
A good documentary on that process can be found here (Floored, time stamp 29:04); back then, it was a limit up.
Note: Posts on this site are for education purposes only. They provide one firm’s insight on the markets. Not investment advice. See additional disclaimer here.
Momentum indicators are pointing higher for both gold and the miners … that does not mean it’s a buy (not advice, not a recommendation).
For both GDX, and GDXJ, they’re entering up-thrust (potential reversal) territory as discussed in a previous post.
It’s time to monitor the sector for potential exhaustion and change of momentum.
That momentum could take a while to bleed-off … being patient is just one requirement for successful speculation.
Summary
From the panic, you would think no one’s ever seen a down market. On top of that, we’re potentially just getting underway.
This is the exact environment where Wycoff analysis comes to the fore: ‘What’s the market saying about itself?’
That analysis says, gold and the miners could still push a bit higher but there are huge disconnects under the surface; not the least of which, silver’s also not confirming the move.
Note: Posts on this site are for education purposes only. They provide one firm’s insight on the markets. Not investment advice. See additional disclaimer here.
Note: Posts on this site are for education purposes only. They provide one firm’s insight on the markets. Not investment advice. See additional disclaimer here.