While the media’s wasting no time setting up the average investor, for a ‘guaranteed skinning’ (as Dr. Elder used to say), providing an environment of constant, incessant, AI ‘get-in-now’, buy recommendations.
With that said, an ominous market sign has appeared.
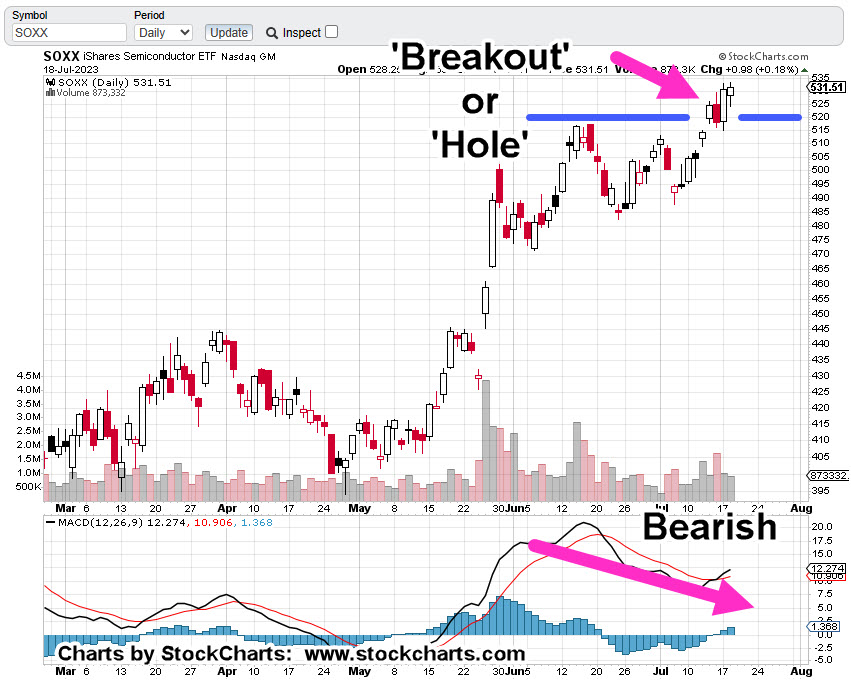
As the daily chart of SOXX shows, we either have a breakout or a hole that’s about to be filled (reversed).
Semiconductor Index SOXX, Daily
In technical terms, the SOXX is in Wyckoff ‘Up-Thrust’, reversal position (not advice, not a recommendation).
A tick lower in MACD, confirms the bearish divergence.
Then, there’s Fibonacci
Enter, The Count
When markets are in a mania, reaching insane extremes, it allows for a (more) clean print of either Fibonacci retrace levels or time correlation.
Decide for yourself if that’s the case now.
Remember, tomorrow (Wednesday) is the 19th, and one day before Taiwan (TSM) releases earnings.
That release is scheduled for the 20th before the open.
Note: Posts on this site are for education purposes only. They provide one firm’s insight on the markets. Not investment advice. See additional disclaimer here.
Note: Posts on this site are for education purposes only. They provide one firm’s insight on the markets. Not investment advice. See additional disclaimer here.
We’re going to start first, with this link, presenting the on-going fundamentals of the sector.
For those of us literally pulling their hair out, wondering if the dam is ever going to break, we have this link.
‘We’ve just poisoned 5-Billion people …’
Note: The dam break is the ‘event horizon’ where everyone collectively wakes-up. Once that happens, the ‘conspiracy’ has been proven as undeniable fact.
Biotech SPBIO, may or may not have an absolute direct connection with the aforementioned links but it’s the ‘baby with the bathwater’ response that’s expected.
Adding to that, big players in this sector have no P/E
The top-ten weightings keep changing, but the last time it was checked, none in the top-ten, had a P/E.
Since we’re working the short side, it’s the leveraged inverse fund LABD that’s of interest.
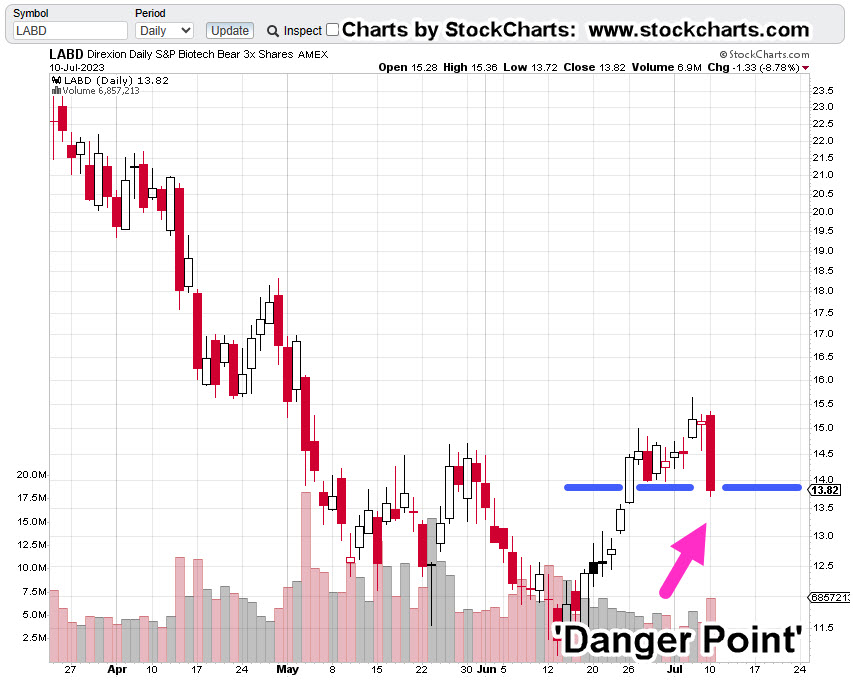
Biotech Leveraged Inverse LABD, Daily
Note the near perfect Fibonacci time correlation.
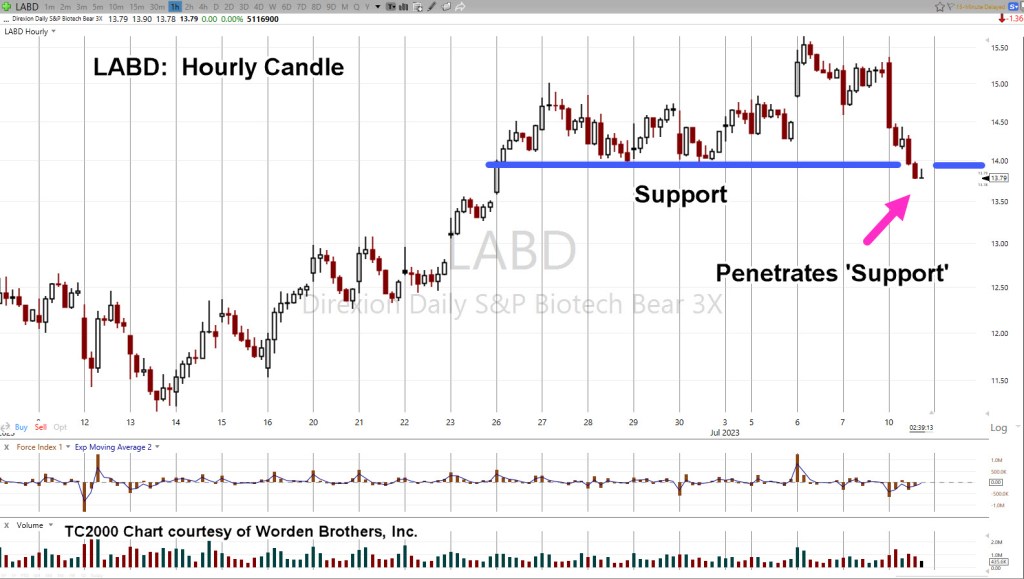
As of today’s close, price action on the LABD has got itself into a Wyckoff ‘spring position’ having decisively penetrated support (blue line), shown below.
That spring set-up has been accomplished on weak down-thrust when compared to the prior move lower.
We have a high probability of upside reversal, down for SPBIO (not advice, not a recommendation).
Positioning
Stated in the prior update, we’re short this sector (long LABD) and now have Hard Stop @ LABD 13.27 (not advice, not a recommendation).
Update: 7/13/23, 2:51 p.m. EST
LABD price action pushed to 13.26, just 0.01, below the above listed stop and is now moving higher.
Trade has been maintained (not advice, not a recommendation)
Note: Posts on this site are for education purposes only. They provide one firm’s insight on the markets. Not investment advice. See additional disclaimer here.
Note: Posts on this site are for education purposes only. They provide one firm’s insight on the markets. Not investment advice. See additional disclaimer here.
Note: Posts on this site are for education purposes only. They provide one firm’s insight on the markets. Not investment advice. See additional disclaimer here.
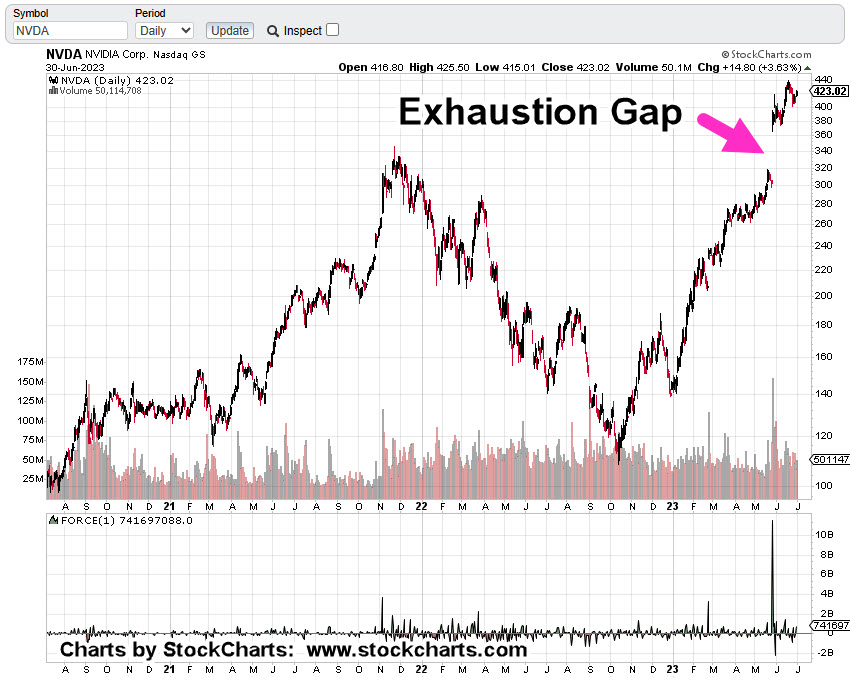
The ChatGPT craze lasted just long enough to ramp Nvidia and the SOXX, to stratospheric levels.
In the coming weeks and months, we’re likely to see who ‘cashed-in’ (a la Elon Musk) and for how much.
When a bull market nears the end of its lifecycle, it tends to thin-out.
As the smaller cap stocks fall away and underperform, they’re sold and that capital’s funneled into the ‘last man standing’; in this case, Nvidia (NVDA).
Broadcom (AVGO) is there as well, but it’s a distant second at 1/3rd, the market cap of NVDA.
Short Positioning
We’re short this sector via SOXS (not advice, not a recommendation) with entries shown in the prior update.
There was a third entry on 7/6 (not shown), but it’s minimal size when compared to the others.
Now, on to the charts
Semiconductor Leveraged Inverse Fund, SOXS
The following chart has the current hard-stop progression and soft-stop (trader discretion) locations.
Moving in closer with the zoom version.
The ‘AI’ bulls are in their brain stem (un-thinking), enabled in their fantasy by articles like this one and this one.
Of course, there’s more like here and here but we get the picture.
Taiwan Semi (TSM) Earnings Date
At the time of this update, TSM earnings date was an estimate, now confirmed as July 20th, before the open.
Note: Posts on this site are for education purposes only. They provide one firm’s insight on the markets. Not investment advice. See additional disclaimer here.
The top in the SOXX, was correctly identified, here.
The potential completion of the downside test and reversal was discussed, here.
After that last post, the SOXX limped higher for one day, before reversing, today.
In fact, today’s session lows took out the daily lows of the prior two sessions.
This update will be brief.
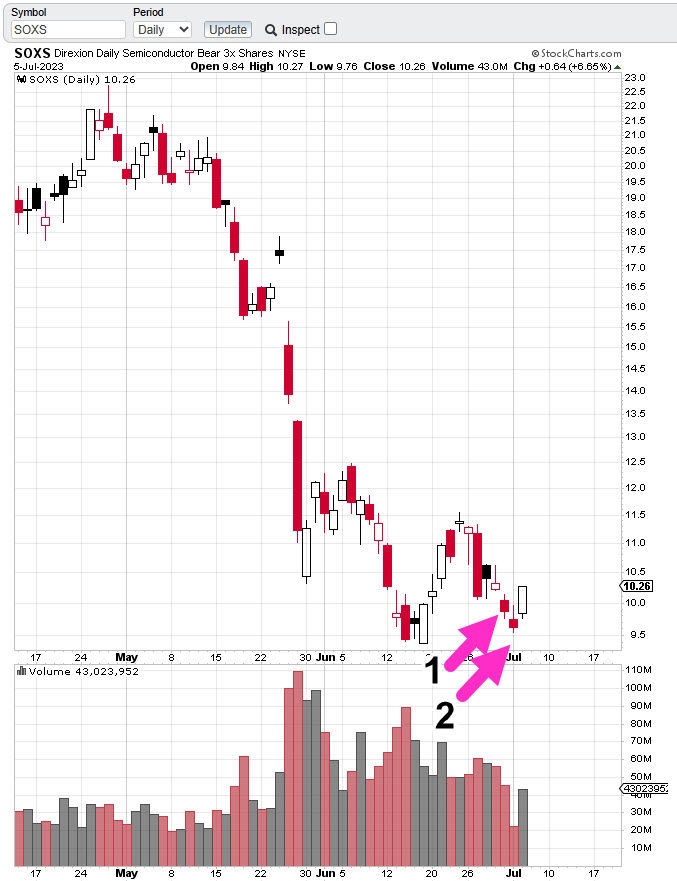
A short position (via SOXS) was initiated on Friday June 30th, then increased by 20%, this past Monday, July 3rd (not advice, not a recommendation).
Semiconductor Leveraged Inverse Fund SOXS, Daily
Entries are shown as Arrow No. 1 and No. 2
An original soft stop (trader discretion) and hard stop were given of 9.75, and 9.48, respectively.
Price action on Monday pushed through the soft stop and trader discretion was to maintain the position.
As a result of today’s action, the hard stop has been moved up to SOXS 9.54, with a soft stop at today’s SOXS low of 9.76 (not advice, not a recommendation).
Note: Posts on this site are for education purposes only. They provide one firm’s insight on the markets. Not investment advice. See additional disclaimer here.
Note: Posts on this site are for education purposes only. They provide one firm’s insight on the markets. Not investment advice. See additional disclaimer here.
From a strategic standpoint, this past Friday was the end of the Quarter and possibly the lowest risk spot to short the semis (not advice, not a recommendation).
‘Low risk’, does not mean, ‘no risk’.
We’ll look at the chart below for the SOXX, but first some housekeeping on the Junior Miners, GDXJ.
As stated in the last update, if there was more GDXJ, upside, shorts (via JDST) would be exited. That’s what happened with an overall gain of + 3.57%, on the series (beginning 6/16/23).
Now, on to the next circus … Artificial Intelligence; more specifically, NVDA and its cohort, the SOXX.
Where’s The Money?
With the quarter over, money managers have dutifully shown they’re like everyone else, ‘investing’ in AI.
That’s out of the way, so let’s move on to the specifics:
Referring back to the excellent investigation done by The Maverick, in his view, the $11 Billion, is “Fantasy”.
The tricky part from a chart standpoint, is to identify when or if that fantasy is going to be exposed.
Semiconductor SOXX, Weekly (Inverted)
We’ve taken the weekly chart of SOXX, and inverted it as if going long the leveraged inverse SOXS (not advice, not a recommendation).
Downside force dissipating with each major thrust.
Last week was an ‘inside week’; price action could not make a new weekly low.
Couple that with end of quarter, potential ‘window dressing’ and this past Friday, may have been the lowest risk point, for shorting via SOXS (not advice, not a recommendation).
Analysis … not Advice
This site cannot and will not give advice.
What it can do, is provide analysis and strategy so that you can make your own determination on the market.
With that said, the ‘heads-up’ for a top in the SOXX, was posted on June 17th, link here.
Since that time, the SOXX reversed down and has now come back to test.
Positioning
On Friday, the SOXX, was shorted by entering long the inverse fund SOXS, at 10.01.
Soft stop (trader discretion) for the position is the session low at 9.75, and hard stop (no excuses exit) at all-time low of 9.48 (not advice, not a recommendation).
The coming weeks may prove interesting. All eyes will be on that ‘$11-Billion’.
Note: Posts on this site are for education purposes only. They provide one firm’s insight on the markets. Not investment advice. See additional disclaimer here.