Note: Posts on this site are for education purposes only. They provide one firm’s insight on the markets. Not investment advice. See additional disclaimer here.
Best Buy’s breaking a trendline that’s been in effect since December 1991.
The weekly chart (below) has zoomed-in to the last 13-years or so, showing the magnitude of the breakdown.
While the financial press plies their trade, this just out as the latest effort to confuse whoever is still listening, anyone with two BBY gift-cards rubbing together feels in their gut, we’ve gone straight past ‘recession’ and into ‘depression‘ (not advice, not a recommendation).
The chart of BBY, itself, is telling us there’s been a (potential) massive change of direction.
Best Buy (BBY), Weekly Close
The lower dashed trend-line continues all the way back to December 1991.
The wedge ‘throw-over’ lasted an incredible Fibonacci 21-months, from July of 2020 to the ‘test’ in March of 2022.
Lower price action confirmed that reversal and now, we’re breaking down from the 32-year long formation.
Positioning
From a personal standpoint, I have no plans to short BBY at this time.
However, BBY price action can, and is being used as confirmation to remain short (of not stopped out) via the biotech trade LABD-23-11 (not advice, not a recommendation).
Note: Posts on this site are for education purposes only. They provide one firm’s insight on the markets. Not investment advice. See additional disclaimer here.
The ‘Week 1’, and ‘Week 13’, designations show the time between pivot-points; Fibonacci 13-weeks.
‘Normal’ market behavior is to come back and test the underside of congestion from the May – June, reversal of 2022 (green dashed line).
However, we all know at this point, it’s anything but normal in the markets or anywhere else.
Positioning
The short position in the sector, LABD-23-11, is active and has been documented here.
As a result of price action, the stop on LABD-23-11, is being moved up (from LABD 21.65) to the Leveraged Inverse Fund’s low of October 24th, LABD 25.66 (not advice, not a recommendation).
Note: Posts on this site are for education purposes only. They provide one firm’s insight on the markets. Not investment advice. See additional disclaimer here.
Note: Posts on this site are for education purposes only. They provide one firm’s insight on the markets. Not investment advice. See additional disclaimer here.
Well, pretty much everything is unraveling, so in a sense biotech’s no different.
However, this sector (SPBIO, $SPSIBI), is the weakest of all the major indices (from 2020 – 2022, highs), down approx. 62%.
We’ll get to the ‘history repeats’ part farther down but first a reminder, this site’s about Strategy, Tactics, and Focus, i.e., Livermore, Wyckoff, and Loeb.
It looks like we’re already in a full-blown economic, societal (population) collapse, i.e., Strategy.
Biotech appears to be the weakest sector, i.e., Tactics.
The (shorting) action is on that sector exclusively, i.e., Focus.
Not advice, not a recommendation.
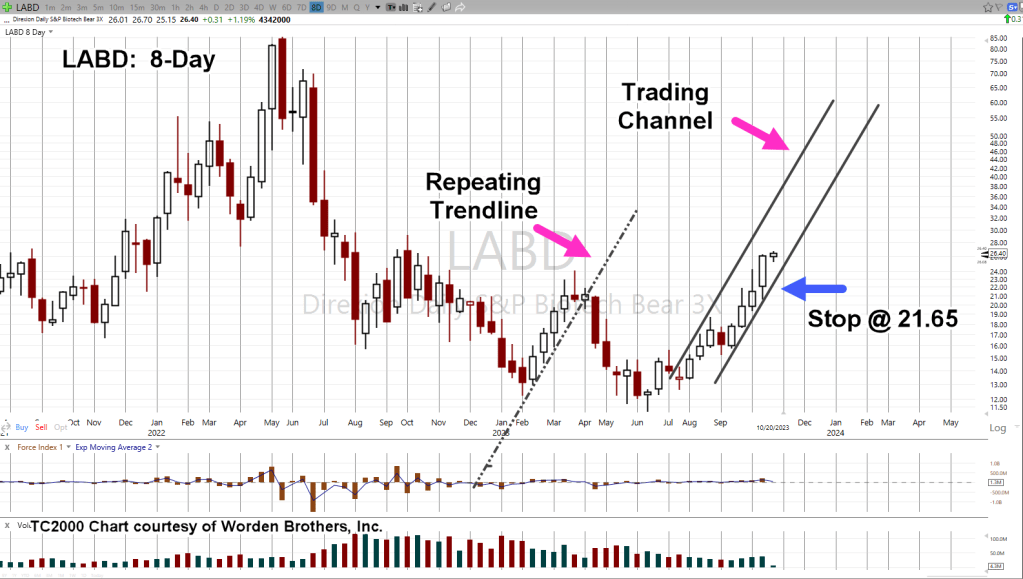
Biotech Leveraged Inverse LABD, 8-Day
Since the Fibonacci 8-Day chart was used for the update on gold, GLD, we’ll use it for this post.
All trendlines shown on the chart are exactly parallel.
The market itself has presented a tendency to trend at the rate shown in the ‘Trading Channel’.
It’s happened before; identified as ‘Repeating Trendline’.
Positioning
This series of short trades on SPBIO, opened via LABD, and identified as LABD-23-10, LABD-23-11, are fully documented here, here, here, here, here, here, here, here and here.
From a Wyckoff perspective, the market itself is telling us to ‘do nothing’, maintain the trade unless stopped out (not advice, not a recommendation).
Note: Posts on this site are for education purposes only. They provide one firm’s insight on the markets. Not investment advice. See additional disclaimer here.
Note: Posts on this site are for education purposes only. They provide one firm’s insight on the markets. Not investment advice. See additional disclaimer here.
First off, before we get started, there’s this on ZeroHedge; Gold price out of control?
The short answer is ‘probably not’ and we’ll use the confirmation proxy Silver (SLV), as our example (not advice, not a recommendation).
The Silver Non-Confirmation
In a traditional ‘inflation’ scenario, silver and gold typically move in tandem.
We can see that’s the case during the last (major) inflation event back in the late ’70s and early ’80s.
Gold spiked right along with silver; Gold chart link here. Silver chart link here.
That Was Then
What we have now, is different. Something’s wrong.
Silver’s not confirming the price rise of gold; Silver vs. Gold, link here.
There’s a massive divergence between the two.
Silver (SLV) Weekly Close
The SLV weekly, shows we’ve broken down from a wedge, now testing the underside of resistance.
Silver more than gold, is tied directly to the economy; over half of all silver is used in production.
It seems, production is about to fall off a cliff.
Evidence can be seen in a corollary indicator, layoffs.
Mass Layoffs
As Michael Cowan shows (time stamp 1:30), layoffs are accelerating.
Let’s not forget, ShadowStats shows its own unemployment indicator, already at Depression Era levels.
Positioning
On this site, beginning in mid-September, short positions (via LABD) were opened in possibly, the weakest sector, biotech, SPBIO, $SPSIBI (not advice, not a recommendation).
The initial position was stopped out (gain around +21%), then re-established the same day (LABD-23-11) with an LABD entry of 21.69.
So far, with today’s action, LABD’s trading around 23.90; approximately + 10% from the entry.
In addition, we now have a new Hard Stop @ LABD 21.65, yesterday’s low (not advice, not a recommendation)
Note: Posts on this site are for education purposes only. They provide one firm’s insight on the markets. Not investment advice. See additional disclaimer here.
Today’s price action is near the right-side channel line and downside energy (RSI) has a bullish divergence as shown.
What happens at the next session may result in maintaining the trade (LABD-23-11) or getting stopped out (not advice, not a recommendation).
Recall, the overall trend is down and the bullish set-up shown below, can sometimes get overpowered to the downside.
Biotech SPBIO ($SPSIBI), Daily
The short position via LABD, has a tentative stop in the vicinity of LABD 22.01, but this is not a hard stop (yet).
Hard Stop is still set @ LABD 20.54 (not advice, not a recommendation).
Next Session
The ideal situation for the LABD-23-11, short, is a higher open for LABD, and a higher daily high.
If price action performs otherwise, it’s possible I will take a discretionary exit on the position and go to the sidelines (not advice, not a recommendation).
Note: Posts on this site are for education purposes only. They provide one firm’s insight on the markets. Not investment advice. See additional disclaimer here.
‘Buckle your seatbelt Dorothy, ’cause Kansas is going bye-bye’
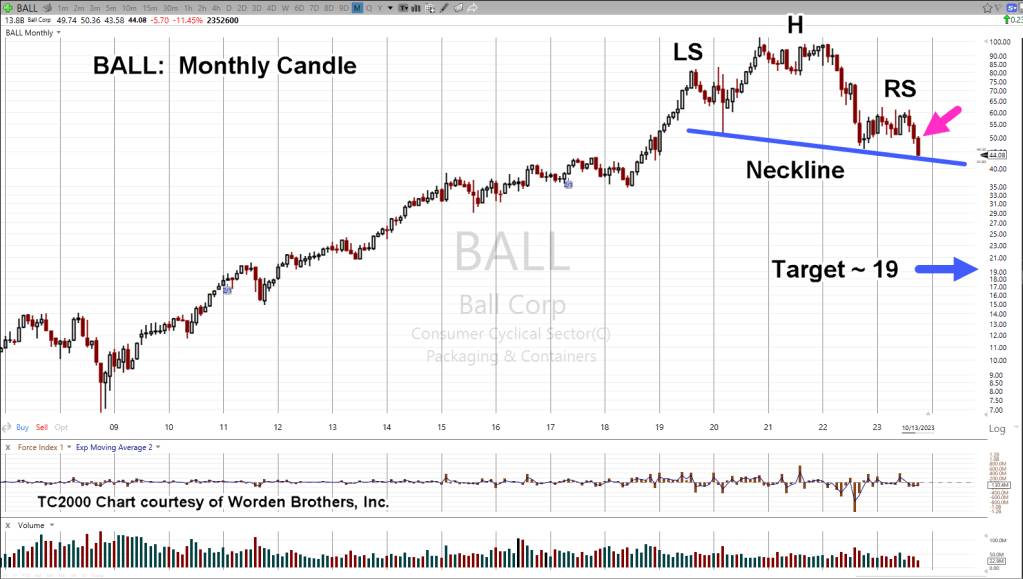
Right along with the airlines, packaging and containers (like BALL), are down hard from their all-time highs, posted long ago.
As of Friday’s close, BALL is down a stiff – 57%, from its 2020 highs and we could be just getting started.
Do Not Pass ‘Go’
It’s the opinion of this author, we never had or are going to have, a ‘recession’.
We went straight past that, right into ‘depression.’
The monthly chart below, has a massive Head & Shoulders pattern that’s been years in the making.
Ball Corp. (BALL), Monthly
From a textbook standpoint, this is near perfection.
An obvious Left Shoulder, Head, and Right Shoulder.
The Neckline is sloping downward, indicating weakness.
The retrace from the October 2022 lows (not shown), has managed only Fibonacci 23.6%, providing confirmation of significant weakness.
The magenta arrow shows it’s been three months in-a-row (the ‘breakdown’) of lower action.
Penetration & Support
BALL, has penetrated prior lows posted during October 2022, and we’re currently at the neckline.
That means Wyckoff ‘spring’ position (penetrating the lows) and there’s a potential for some type of upward action; not much, but the possibility is there.
Positioning
BALL may present the opportunity for a direct short (borrowing, selling the actual stock), with good daily volume and dividend of only 1.8% (not advice, not a recommendation).
Note: A direct short puts the trader on the hook for paying the dividend and any other upward short covering ‘surprises’ … risky indeed.
Note: Posts on this site are for education purposes only. They provide one firm’s insight on the markets. Not investment advice. See additional disclaimer here.
With this session’s price action continuing lower, getting back into the short trade (via LABD) was the correct move (not advice, not a recommendation).
With that said, we’re nearing the dangerous part.
Downside pressure continues to build.
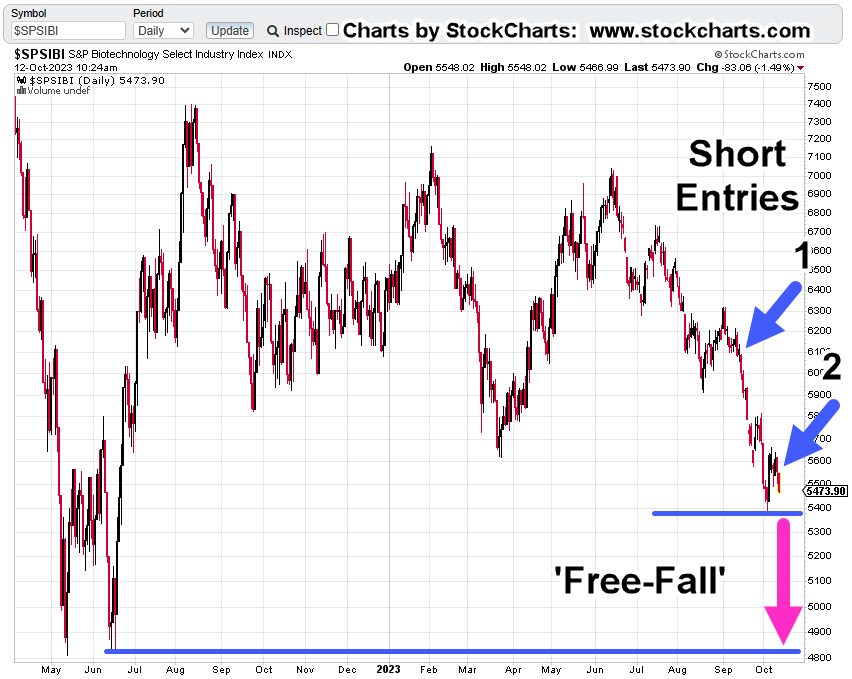
As the chart shows, SPBIO ($SPSIBI) is close to the point where there’s no more support until much lower levels.
Biotech SPBIO ($SPSIBI), Daily
The Blue arrows highlight short entries (via LABD).
Short No. 1 was subsequently stopped out yesterday, then re-established (the same day) at the next arrow, No. 2.
If and when price action gets to the ‘free-fall’ area, anything can happen.
We could bounce off the support level, hover at it, or slice straight through.
Positioning
It’s obvious this sector’s in trouble. The fundamentals continue to build.
Just a few days after this post we have two more to add to ‘The List’, here and here.
Yesterday’s post showed a not-so-good entry that at this point in today’s session, has been ‘healed’ by price action.
We’re well above that (LABD 21.69) entry and solidly in the green (not advice, not a recommendation).
The stop on the LABD-23-11, position is now being moved (tentatively) higher at today’s low of, LABD 22.01.
Note: Posts on this site are for education purposes only. They provide one firm’s insight on the markets. Not investment advice. See additional disclaimer here.