When a stock market trader starts quoting Revelation, you know it’s bad or about to get that way.

That’s what we have here (time stamp 14:20) where David Dubyne and Bob Kudla discuss a variety of events but mainly, the world’s food supply.
“And I heard a voice in the midst of the four beasts say, A measure of wheat for a penny, and three measures of barley for a penny; and see thou hurt not the oil and the wine.” Revelation 6:6
This site has presented in past updates sufficient data to show the nation’s food supply is being systematically dismantled via at least two avenues.
First:
Naturally occurring disasters are intensified (or outright created) by weather manipulation.
Second:
The planting and harvesting infrastructure is being intentionally disrupted or dismantled by what this site has termed ‘the speck’.
By now, anyone accessing these posts should know what the (imaginary) speck is and it’s even discussed in the above links. The press (financial and mainstream) talk about the speck incessantly.
Put the lie out there long enough and eventually it will become belief.
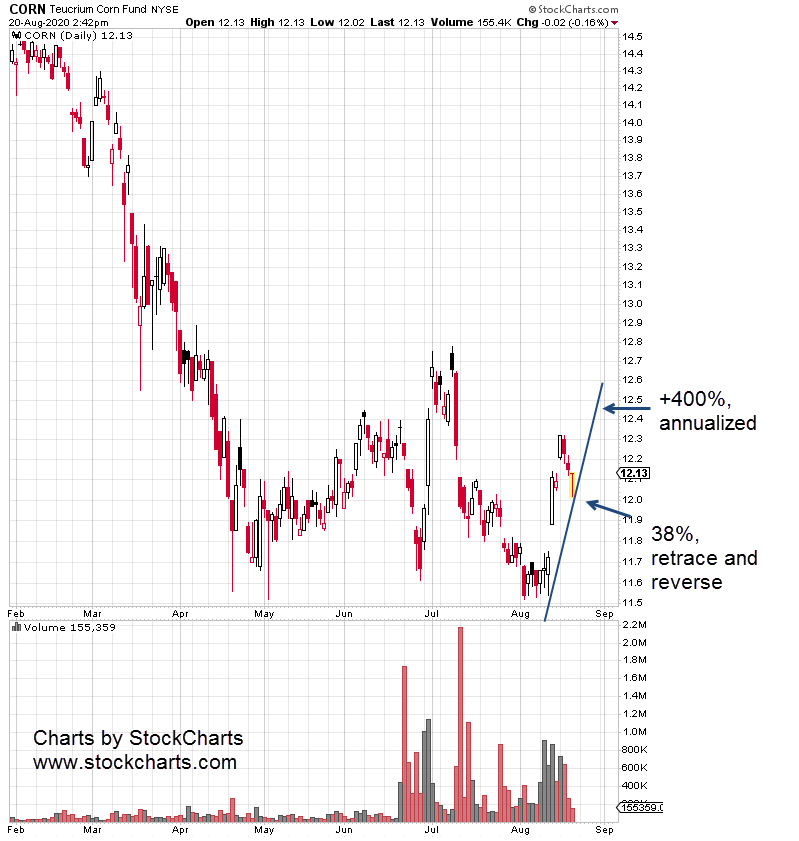
Back to the markets and more specifically, CORN
CORN was a trade that was entered by the firm but then decided the look was not right and exited at essentially break-even. That trade was entered right around the area that’s now labeled as a 38% retrace level.
The trade would have been modestly profitable but it’s not what we’re looking for. What we’re looking for may be yet to come.
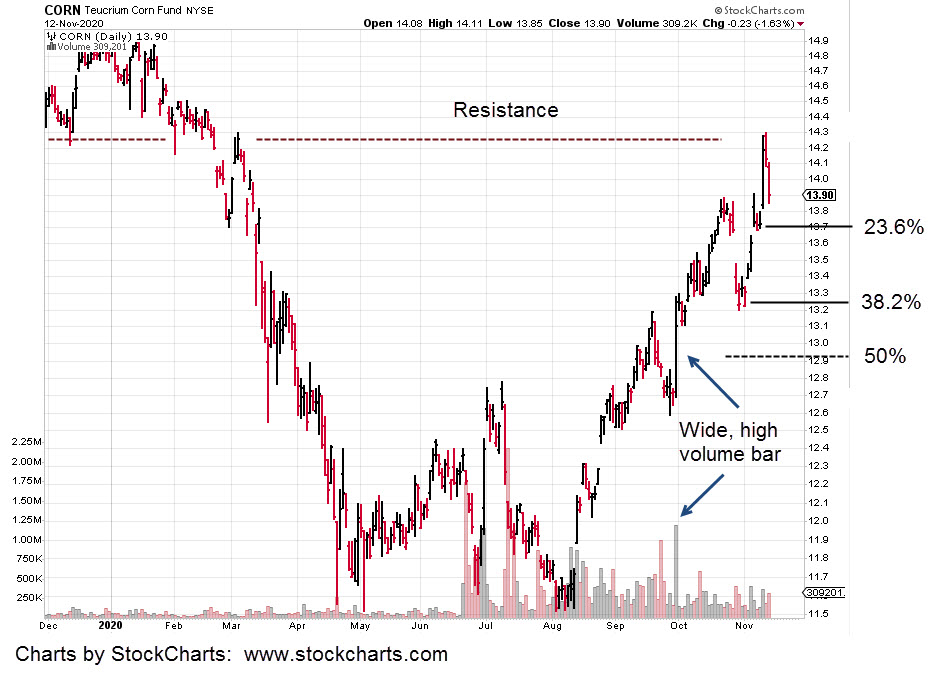
The 38%, retrace level is now well established support and if penetrated by subsequent price action would generate a reversal condition known as a Wyckoff spring.
Shown on the chart as well, is the wide high-volume price bar that’s right in the middle of the 50%, retrace level.
This is where it gets interesting. Markets behave in such a way as to come back to high volume areas for a test.
If somehow, CORN retraces to this level for a test of the wide bar, it will automatically set-up a spring (reversal) condition by penetrating price action at the 38% level.
Our edge in this situation, are the bullet items discussed above. The entire world’s food supply is in jeopardy. That’s a known fact.
Crops are failing world-wide. Weather patterns are erratic and manipulated.
Knowing this provides a fundamental backdrop that should CORN retrace to test the wide bar, it’s not likely to stay there long.
In addition, if CORN reaches the 50% area, it may never come back to those levels.
Charts by StockCharts


 Trading books and specifically
 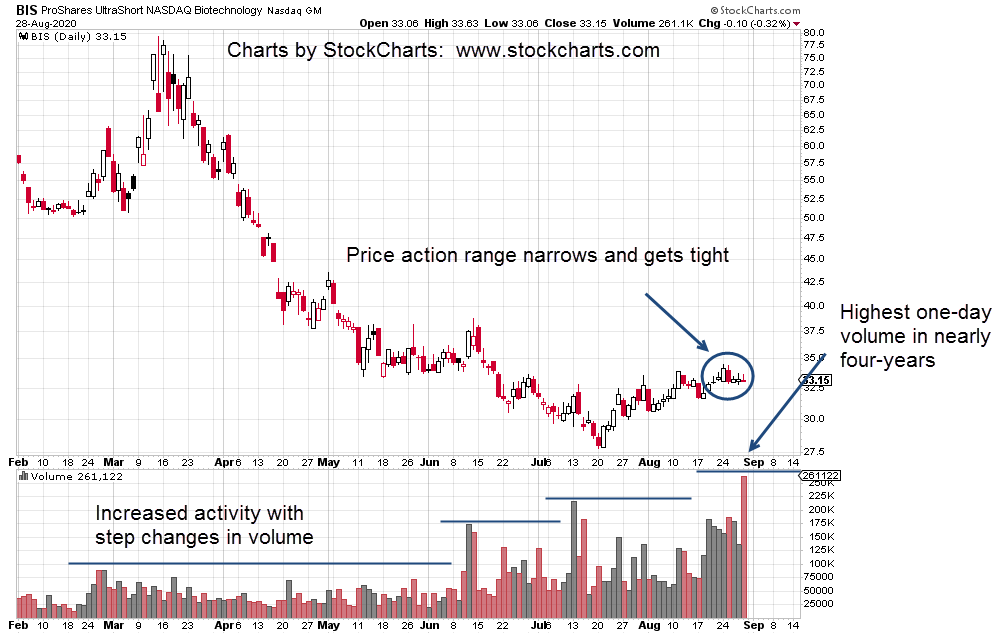 Speculative volume for potential downside in biotech is increasing. Last Friday’s volume in BIS was the highest in nearly four years.
 Changes in character; price action, volume or both, tells us something’s gong on behind the scenes.
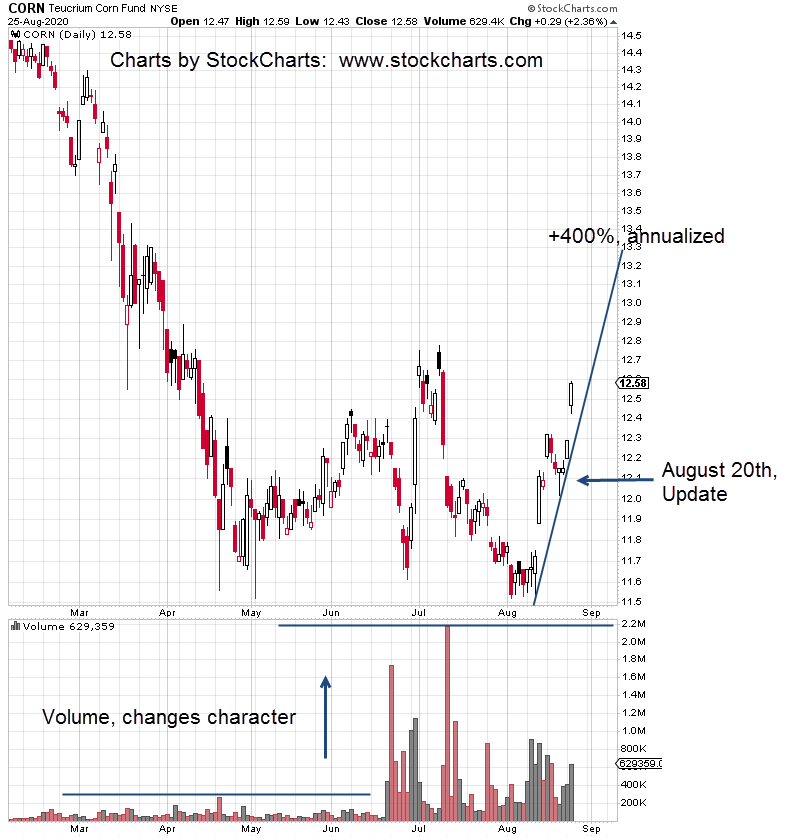
 Meanwhile, back at the farm (literally), the food supply is undergoing controlled demolition.