The Rule of Alternation

That’s it in a nutshell. What happened last time, won’t happen this time.
The market reveals its own secrets; you just have to know where to look.
An entire industry has been (purposely) built to make sure the ‘average investor’ never finds the truth of the markets.
That industry is the financial analysis industry; the one with the P/E ratios, Debt-to-Equity, and so on.
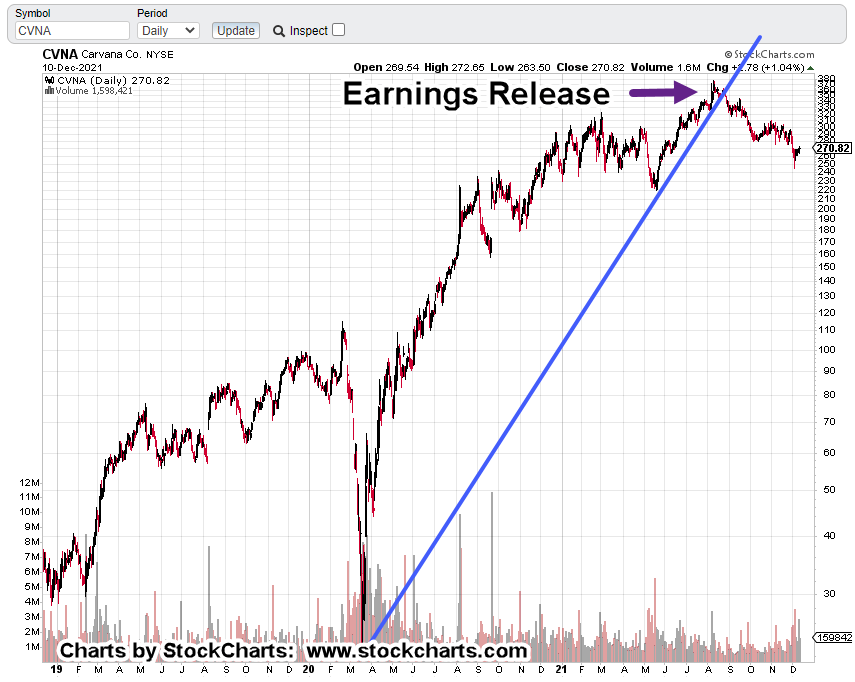
Sure, it was a tongue-in-cheek post to use the fact that Carvana had no P/E (linked here).
I’m not certain if they ever had a P/E; probably not.
However, that financial, i.e., fundamental(s) fact, did not keep the stock from going up over 4,529%, in four years.
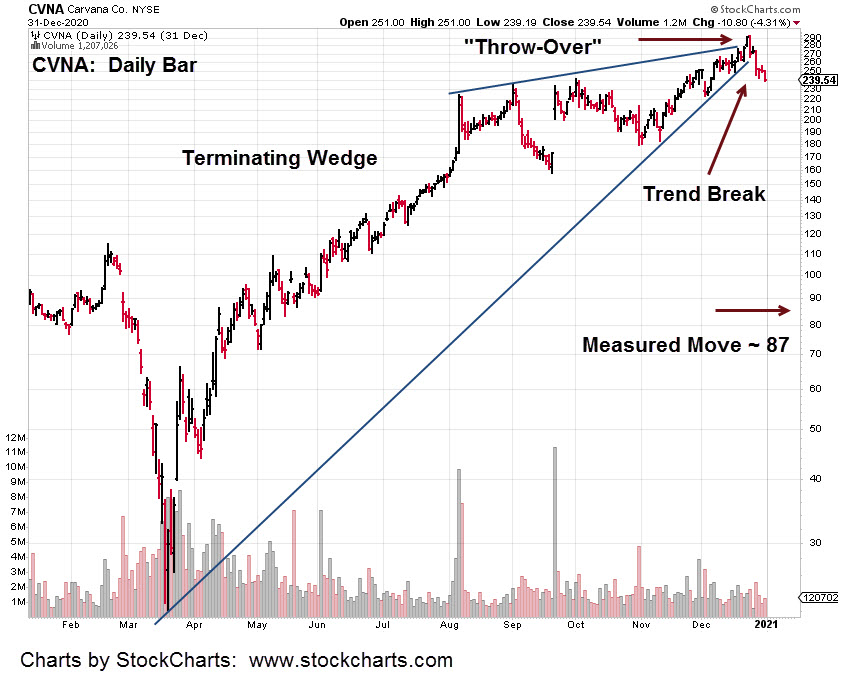
It should be noted, the Carvana analysis was done on a Saturday (as has this one). At the very next trading session, CVNA posted lower, started its decline in earnest and never looked back.
Not saying that exact thing (timing it to the day) will happen with our next candidate real estate; as said before, part of Wyckoff analysis (a lot of it, actually) is straight-up intuition.
The good part from a computer manipulated and controlled market perspective, intuition can’t be quantified.
So, that’s your edge.
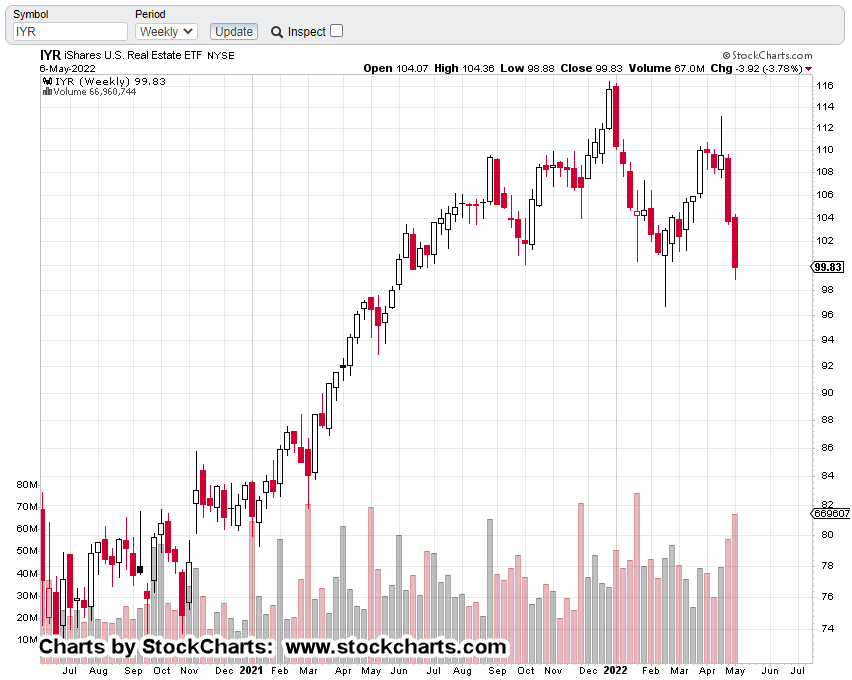
Let’s move on to ‘last time is not this time’ and see what the real estate market IYR, is telling us.
Weekly Chart, IYR
We’ve got the weekly un-marked chart of IYR, below.
The ‘alternation’ is there.
Here it is, close-up.

The first leg lower had some initial smoothness but quickly became choppy and overlapping.
Not so, now.
We’re essentially heading straight down.
Fundamentals
From a fundamental standpoint, real estate is finished. However, it’s been finished for a long time.
The fundamentals won’t and can’t tell anyone what’s likely to happen at the next trading session … or any other session.
The market itself (shown above) is saying the probabilities are for a continued decline; posting smooth long bars until some meaningful demand is encountered.
As shown on the last post, if the trading channel is in-effect, that (chart) demand is a long way down.
Positioning
Shorting IYR via DRV, has been covered in previous posts (search for DRV-22-02).
The following weekly chart, is marked up with two arrows.
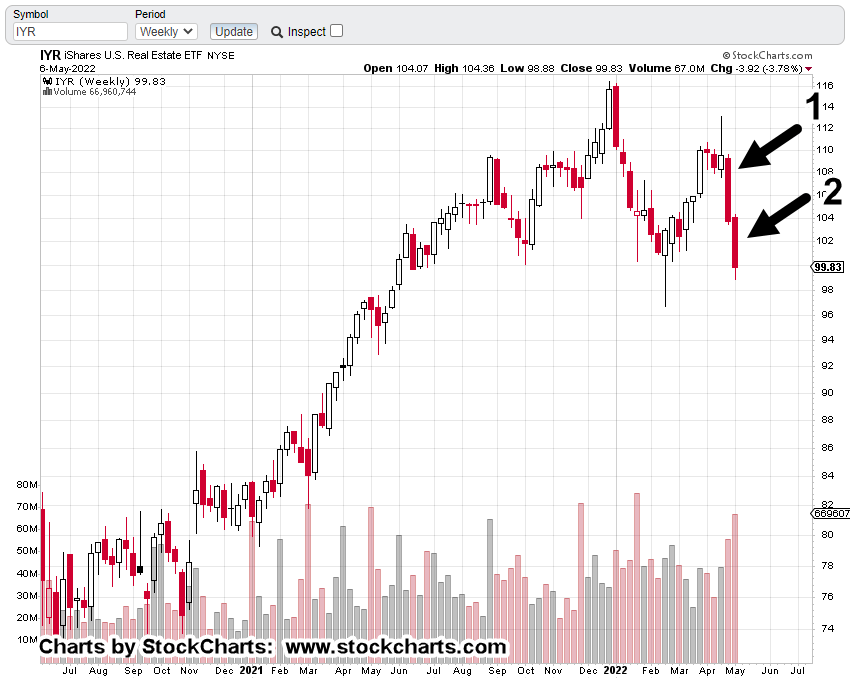
Arrow No. 1
Initial short position via DRV was opened late in the day on April 28th; the day before the market broke significantly lower (not advice, not a recommendation).
Arrow No. 2
As the market headed lower during the week just ended, the size of the DRV position was increased by 36%.
Currently, the gain on the total position is about +22%.
At this juncture, the DRV stop is located well in the green in the unlikely event we get a sharp IYR, upward move in the coming week.
Summary
Under ‘normal’ conditions one could expect some kind of upward bounce in the days ahead.
However, as shown already with big cap leader PLD, the situation’s anything but normal.
Highlighted in earlier posts, biotech is leading the way with SPBIO, currently down – 59.8%, from its highs.
Biotech IBB, with chief cook and (globalist) bottle washer Moderna (MRNA), is down – 36.2%.
As Dan from i-Allegedly has stated time and again, we’re already in a depression.
So, buckle your seatbelt Dorothy …
Stay Tuned
Charts by StockCharts
Note: Posts on this site are for education purposes only. They provide one firm’s insight on the markets. Not investment advice. See additional disclaimer here.
The Danger Point®, trade mark: No. 6,505,279