Hyperinflation: Hit Hard

The regular session is still thirty minutes away and already gold’s had it’s largest down-swing since August 11th.

Bulls must be stunned.  It’s not supposed to be this way.

Of course, the financial press has to come up with some kind of ‘reason’, so there’re off plying their trade. 

At this juncture, before the open, December gold is down about 4%. 

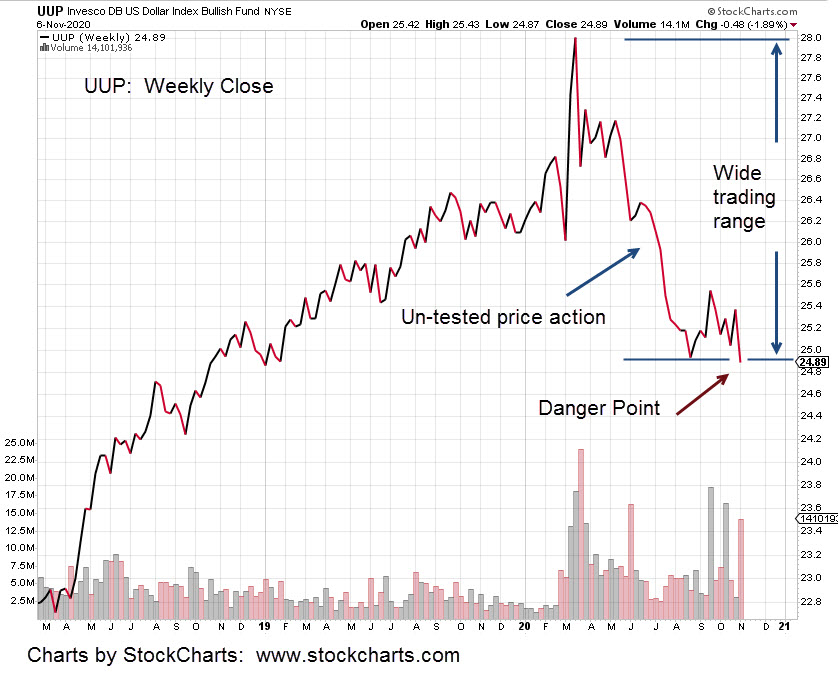
The dollar is slightly higher as forecast but bonds … TLT, down a whopping 2% in pre-market. 

How can bonds be down (rates up) with the dollar higher and gold lower?

The question itself, is an error.

It’s not ‘why’ that’s important, it’s ‘what’.  Asking why keeps one searching for the wrong answer.  It’s exactly what the media and those manipulating the markets want.

The trail of why goes on forever and leads nowhere.  The why is constantly changing second by second, minute by minute. 

Asking ‘what’ is a different story; what is the gold market doing?  Now, that’s a question.

The gold market is down hard; Very hard.  Shocked bulls, married to their ‘hyperinflation’ narrative, will have to see it as a buying opportunity.

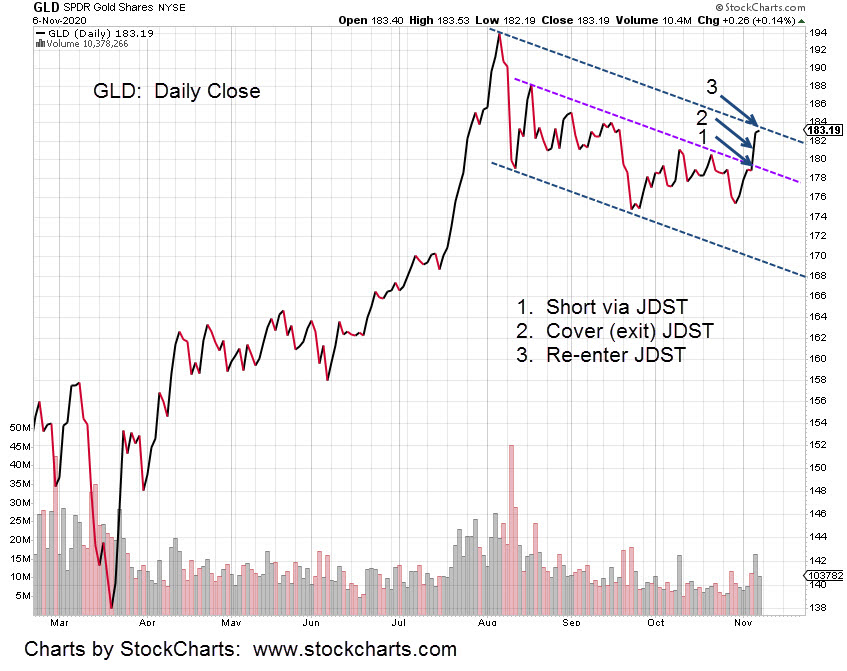
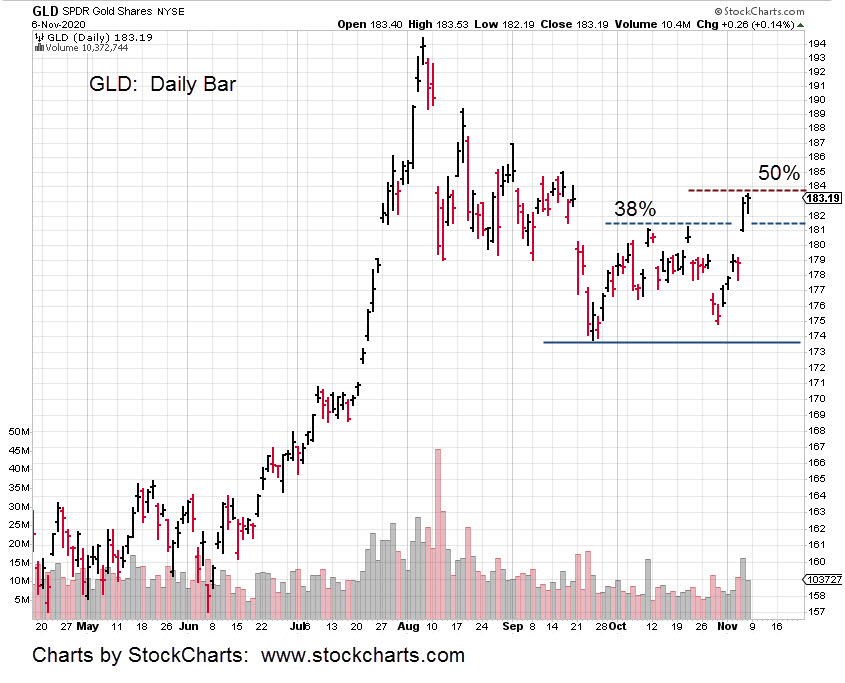
Expect gold to retrace somewhat during this session.  However, the damage has been done. Gold (GLD) is below well established support levels … now resistance areas.

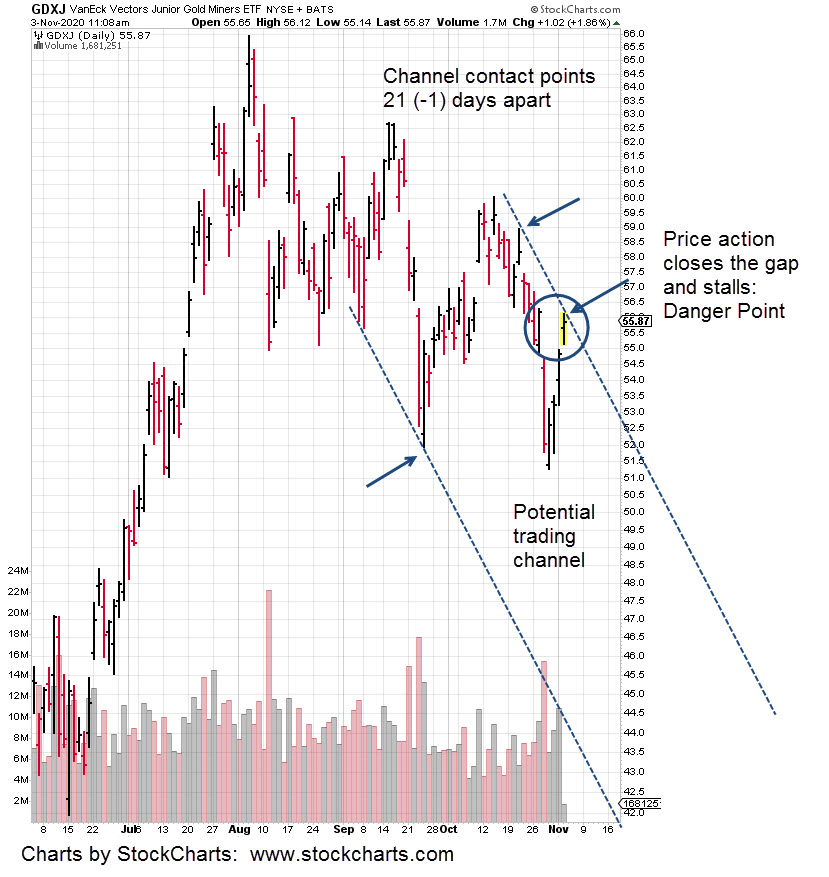
In related markets, the Junior Mining Index, GDXJ is down -5.75% in the pre-market session.  Correspondingly, the inverse fund JDST, is up a stiff 11.5%.

As stated in this update (not advice, not a recommendation), the position in JDST was re-established during Friday’s session. 

Obviously, we’re keeping that position for now and will monitor price action to determine a new stop location.

Note:  Posts on this site are for education purposes only.  They provide one firm’s insight on the markets.  Not investment advice.  See additional disclaimer here.

Dollar Collapse, Now?

If the dollar is going to collapse, this is the place.

Both weekly and daily price action (UUP) closed at new lows.  Gold and silver have moved up in counter action.

However, if the dollar’s going to rally, this is the place as well.

The current uncertainty in the U.S. is all part of the equation.  The emotions of the populace are being tossed about at will. 

The plan is to (always, no exceptions) get the herd pointed in one direction so that a small fraction of speculators can establish their positions cheaply and with low risk.

When it comes to gold and silver it’s obvious where the herd is positioned.  They are ‘all-in’, waiting for the precious metals rally to continue.

The dollar, UUP is at the danger point. A small move in either direction may be the deciding factor.

Looking back at the historical literature available, it was Livermore that coined the term ‘danger point’. It was Wyckoff that published the interview with Livermore where he used the term.

The take-away is, markets do not change.  The same (similar) price action can be observed on charts that are a century old as compared to charts today.

Considering the UUP weekly trading range shown, it’s at the extreme low. 

There’s been no significant upward testing of the wide range.  Markets like to test.  That’s what they do.

Based on empirical and technical factors in prior updates, we’re anticipating a dollar rally and in turn, are short the Junior Miner’s, via JDST (not advice, not a recommendation).

Futures markets open in a few hours.  We’ll see if the current position will need to be exited at tomorrow’s open or if we’ve analyzed probabilities correctly.

As Livermore said, ‘you don’t know until you bet’.

Charts by StockCharts

Note:  Posts on this site are for education purposes only.  They provide one firm’s insight on the markets.  Not investment advice.  See additional disclaimer here.

Inflation Fairy Tale

Truth comes only to those who actively seek it. 

This site works to present truth as background or ‘macro’ as it were and then look for price action set-ups correlating with truth.

It turns out (as some may have suspected) the ‘inflation’ narrative is a myth.  It’s just another lie that’s being perpetrated by the powers that be (TPTB). 

According to Jeff Snider and Steven Van Metre, at time stamp 21:30, there’s no way TPTB are going to correct the public’s perception that hyperinflation is right around the corner. 

It serves their purpose to have the masses in complete delusion … always setting up on the wrong side of the trade.

Using price action itself, problems with the hyperinflation narrative were presented in this update

Gold is near all time highs.  However, Junior Mining Index, GDXJ, and Senior Mining Index, GDX are far below their previous highs.  The junior’s are the weakest and so that’s been the focus.

In a bear market, focus on the weak sectors.

No doubt, there are a lot of well respected traders, analysts, YouTuber’s that are on the bullish side of the market.  Here are just some examples, here, here, and here.

So, at this juncture, this firm is taking the opposite side of the trade with its re-established position in JDST.

Hard stop in the market GTC, is at 8.82 (not advice, not a recommendation).

If stopped out, we’ll reassess and determine if another entry is warranted.

Even if the trade proves to be wrong, it’s a low probability that price action will break out of the GLD trading channel shown (below) in just one attempt. 

Typically, price action needs to retrace (lower) to gain enough fuel for a breakout.

If the retrace occurs, it will put the JDST position in profit with the miners down accordingly.  Doing so gives the ability to analyze the situation with objectivity.

We’re looking for a swing lower to the bottom of the trading range (at a minimum) for GDXJ.  Just a few of the empirical and technical conditions that favor such a move are listed:

Price action (GDXJ) finished at the high of its recent trading range and resistance. It thus created a Wyckoff up-thrust, reversal condition.

The GDXJ move over the past week generated a wide, high volume price bar.  Such areas tend to be tested (retraced) by the market.

GDXJ finished at a high on a Friday.  Monday’s are typically down or a retrace day.

Gold retraced up to its own 50% level and has contacted the right side of a down-trend line.  Lower price action in the coming week is expected.

The dollar has its own reversal set-up in progress. 

Dollar, UUP price action penetrated minor support (Wyckoff spring, reversal condition) and is close to a major support level.

Dollar up, gold down.

In summary are two charts of GLD and one of GDXJ, below:

Charts by StockCharts

Note:  Posts on this site are for education purposes only.  They provide one firm’s insight on the markets.  Not investment advice.  See additional disclaimer here.

Gold & Silver, Retrace Levels

If GLD and SLV maintain their pre-market, 181.40 for GLD and 23.15 for SLV, they will both open at 38% retrace levels.

They each have attempted to reach these areas two times in October and were rejected.

The last update stated that Junior Mining Index, GDXJ has its own Fibonacci level (38% retrace), in the vicinity of 56.80.

Pre-market activity for GDXJ is around 56.38 … very close.

In Wyckoff terms, yesterday’s trading activity for GDXJ was a Sign of Supply.  The index opened lower then tested (higher) and subsequently moved lower throughout the day into the close.

This firm’s trading action (not a recommendation, not advice) will be to monitor the first two hours of trading (GDXJ) to see if we tap the 38% retrace level and subsequently get hourly reversal bars … or some other indication of reversal.

We’re already short with a combined price of 10.93, in JDST. 

Currently, JDST is pre-market trading at 10.40, which equates to just over a 5% loss on the open position. 

Certainly that’s not desirable but then again, if this is all the market can hit us with, we’re willing to wait it out … although not for too long.

Note:  Posts on this site are for education purposes only.  They provide one firm’s insight on the markets.  Not investment advice.  See additional disclaimer here.

Gold Watch

The overnight session was active for gold.  The GCZ20, December futures contract traded between a high of 1,917.90, and a low of 1881.80, a 36-point range, nearly 2%.

Gold is now off the lows and testing its overnight highs.

From a regular session standpoint, we’ll be watching the 179.43, GLD level covered in the last update.

If that high is penetrated it does not mean that gold will continue on higher immediately. 

It would mean that probability is now about even to greater, higher prices are ahead.

From the Junior Mining index, the GDXJ standpoint, there’s a Fibonacci level located at approximately 56.80.

Looking at the big picture, the short squeeze in bonds looks like it’s getting underway in earnest.    

There was just one more downward thrust that was not able to penetrate the TLT, 156.75 lows from the week of October 19th

The overnight move higher in bonds was a serious hit to the shorts. It’s now time to see if this move feeds on itself … higher.

These dynamics, the dollar, gold, interest rates, the four-standard-deviation-short in bonds are all operating simultaneously.

We’re sitting in the background and quietly observing everything. 

The choice at this point (not advice, not a recommendation) is to sneak into a significant short position on the Junior Miner index, GDXJ (via JDST).

We’ll see how it works out.  Obviously GLD and the 179.43 high, is being watched closely.

Note:  Posts on this site are for education purposes only.  They provide one firm’s insight on the markets.  Not investment advice.  See additional disclaimer here.

Gold Top?

Gold has made at least three attempts to post a new weekly (GLD) high.

Now, price action is fading.

Penetrating last week’s high of 179.43, would put GLD on track to continue on to the 181.50 – area.

At this juncture, we’re at 178.84, after three attempts to penetrate that 179.43 level.  Those attempts topped out at 179.04, 179.10, 179.18 and then 179.18 (again), when looking at the 15-minute chart.

That last attempt could not push higher.  We may be finished and pivoting lower.

From the Junior Miners, GDXJ standpoint (chart above), we have what looks like a gap-fill; along with establishing a down-trend and possible trading channel.

It’s never obvious until it’s over.

At this juncture (11:41 a.m. EST) JDST, the 2X Inverse Fund is hovering around 10.60 – 10.64, just above its lows for the session.

Once again, taking all factors into account; the position of GLD, not making a new weekly high, GDXJ filling the gap and then appearing to stall, a potential trend-line and channel; all ties up to be a low risk area (not a recommendation, not advice), the danger point.

Once caveat is GDXJ is not at any well established Fibonacci retracement level.  Price action could grind itself higher into the 56.60 area, no matter what gold (GLD) is doing.

Charts by StockCharts

Note:  Posts on this site are for education purposes only.  They provide one firm’s insight on the markets.  Not investment advice.  See additional disclaimer here.

Before The Open

As expected from the November 1st, update, gold pre-market shows a gap-higher open.   Trading is around 178.80 – 179.00 which is a little above the resistance area shown in the original chart.

After the first hour of trading, the plan is to provide an update to see if there’s still a possibility of a reversal at this juncture (not advice, not a recommendation).

Correspondingly, the mining sectors, GDX, GDXJ are up in pre-market with inverse DUST and JDST, down. 

However, the big hitter, NEM is right at a 50% retrace off the lows of October 28th.  This is a possible area to stall and potentially resume a downward (or sideways) trend.

Other market actions that may have significant impact on silver/gold, are the four-standard deviation in the bonds to the short side.

As Steven Van Metre indicates, none of us reading this (in our lifetimes) are likely to ever see a set-up like this again.  It’s an historic extreme.

Bonds are down in pre-market along with the dollar … using UUP as the proxy.

The dollar has bottomed and is now in position to rally; completely opposite the established consensus.

At least twice now, Van Metre has mentioned Wyckoff in his updates.  He appears to be well aware of the significance.

In other markets, a position was opened in nat-gas, UNG at the last session.  That position was closed in the pre-market session with a slight ding of -1.2% to the managed account.

Even with record cold hitting large portions of the country, nat-gas can’t seem to get going to the upside.  Now, with its current action there may be a probability of lower prices (or stagnant action) going into winter.

We are leaving nat-gas alone for now and focusing on the historic bond set up and the potential effects when it all unravels.

Note:  Posts on this site are for education purposes only.  They provide one firm’s insight on the markets.  Not investment advice.  See additional disclaimer here.

JDST Trade Yields Gain: 18.63%

The JDST trade, discussed over the past several weeks has been closed as of today.

Price action in the Junior Mining Index, GDXJ, declined sharply during the day but failed to decisively penetrate support at the 52.00 area.

Combined entry price for three separate JDST entries (9.98, 10.38, 10.58) was 10.19.  Exit price was 12.09.

Since the short trade was executed with the leveraged inverse fund JDST, we’re not going to wait around to see what happens next.

Inverse funds have a habit of ‘blowing up’ as happed with this exact fund just a few months ago.

These vehicles are absolutely not for the novice and even the experienced pro can get impaled on them every now and then.

In fact, the last substantial trade in JDST was closed out on March 12th, 2020.  That exit was just two days before the fund had its monster disconnect.  Enough said.

On a separate note; because of the price action and position of NEM, it’s now in Wyckoff spring position. It thus has the potential to move higher from here.

Note:  Posts on this site are for education purposes only.  They provide one firm’s insight on the markets.  Not investment advice.  See additional disclaimer here.

What’s wrong with this picture?

The good part about price danger points, price action does not need to go far to confirm or negate the trade.

We’re at that point now with precious metals and more specifically, the junior mining sector, GDXJ.

A brief search for YouTube “gold higher”, turns up the list below. 

The amount of bullish biased videos is easy to find. 

Everybody’s doing it.

Gold To Explode

Embrace The Dip

Growing Debt, Gold higher

Ray Dalio, Gold Price Up

Expect $2,500 Gold Price

Peter Grandich, 100% In On Mining Stocks

Silver Price Will See Explosion

Silver, Time To Buy is Now

How High Will Silver Go?

$36 Silver By End Of 2020

Who wants to hear that a favorite investment or market is heading lower?  

Getting to the chart of GDXJ and what’s wrong; it’s obvious.  

There’s a huge non-confirmation.  

The gold tracking fund, GLD is back at or near all time highs and yet GDXJ (the junior sector), is down -58.8%.

There is no way to paint this in a positive light.  Down nearly 60% is massive. 

One way to look at it is, the junior sector does not believe gold (and silver) prices can be sustained at current levels.

Or, if they are sustained, there must be something else at work that would prevent them form obtaining a substantial profit.

Either way, the last report on the sector stepped through the current price action.  We’re at the danger point for GDXJ.

A move higher in the coming week will put a dent in (or negate) the bearish scenario and a move lower will help to confirm.

Stay tuned

Charts by StockCharts

Note:  Posts on this site are for education purposes only.  They provide one firm’s insight on the markets.  Not investment advice.  See additional disclaimer here.

Newmont: Wedge Breakout

The entire precious metals sector may be about to take an unexpected hit.

Prior updates have discussed the Newmont (NEM) bearish divergence and reversal.  This update shows a rising wedge breakout to the downside.

Using standard analysis techniques on the chart below, we get a measured move to the vicinity of 47 for NEM.

A decline of that magnitude, a drop of over 22%, may be the catalyst for a whole other bearish scenario.

Just based on empirical observation and analysis generally available (YouTube, et al), it’s pretty safe to say that no-one is prepared for a significant decline.

Well, almost no-one.  As reported back in late September, the only YouTube analyst (that was located) proposing the idea of a decline was Sajad, in this report.

Charts by StockCharts

Note:  Posts on this site are for education purposes only.  They provide one firm’s insight on the markets.  Not investment advice.  See additional disclaimer here.