Biotech Short: Technical Discussion

Short out, short in. That was the trade action for Friday, the 25th.

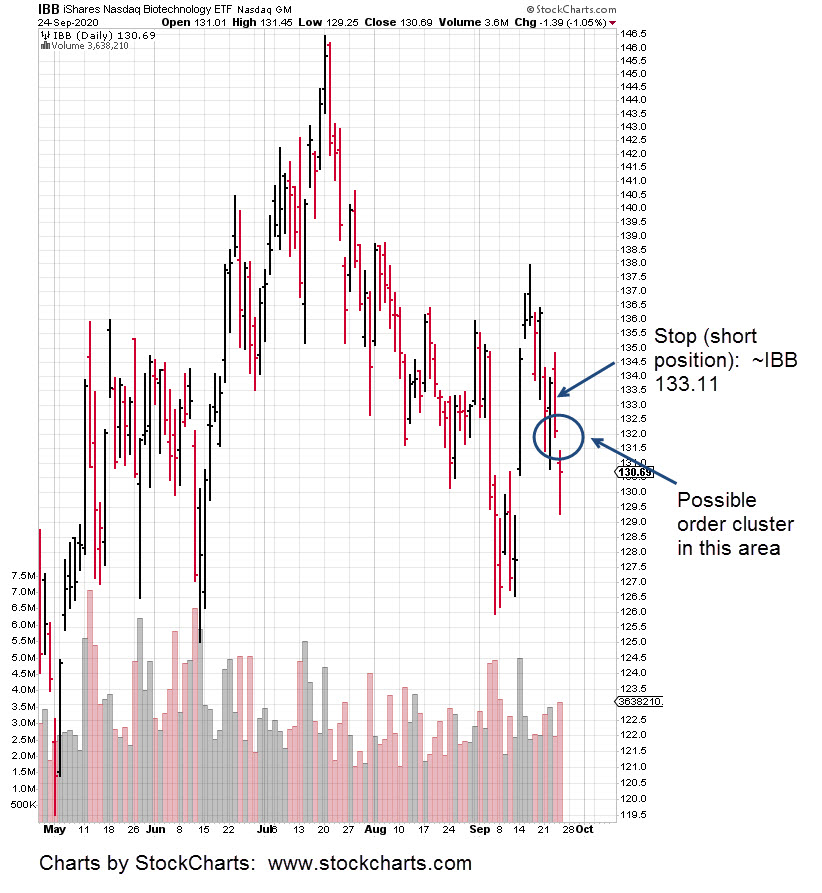
The pre-market update hinted price action would rise; taking out stop orders at the area shown.  IBB did just that and more.

Early in the session, within about thirty minutes it was obvious that we’re moving higher. The BIS position was exited at 33.10.

Profit on the short, held for ten days was about 6.5%.

Price action continued to rise throughout the day. Late in the session, the short was re-established via another position in BIS.

Not expected, was that IBB continued to move higher into the close of the day. 

BIS moved correspondingly lower.

The position is showing a slight loss of -1.5%.  This amount is well within risk parameters but does require that IBB opens lower and moves lower at the next session.

The chart, with an expandable version here, shows we’re at the top edge of an established trading channel. 

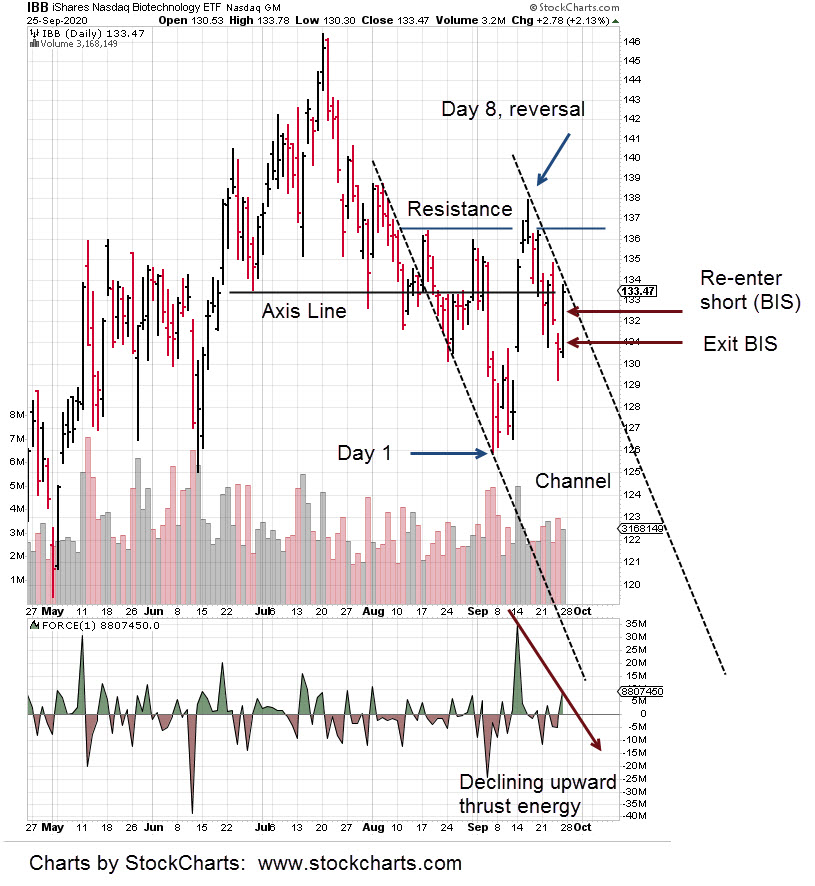
Force Index, upward thrust energy has declined while at the same time price action finished the day right at the axis line shown.

There’s also a Fibonacci time sequence as noted.

The expectation is for a lower open and lower action during Monday’s session.

If price action opens higher, the short-covering scenario as identified in this update, is not in effect; the short position will be closed.

Charts by StockCharts

Note:  Posts on this site are for education purposes only.  They provide one firm’s insight on the markets.  Not investment advice.  See additional disclaimer here.

Amgen At The Edge

The market itself has decided the lower wedge-line is important.

Price action penetrated, then recovered, penetrated again and is now testing the underside.

This oscillation about the line validates its existence and confirms its importance.

AMGN is at the danger point.  Price action can go either way.

Higher, and the wedge has been negated.  Lower and we may have a strategic, long-term reversal.

Separately, the short position via BIS at the trader’s discretion was exited early during Friday’s session.

When it’s obvious, we did not wait around for the stop.

The total profit on the short, held for just ten days, was about four-weeks pay for the typical American worker.

Why list it in those terms? 

With at least 30% of the population out of work and no job in sight, would it not make sense to show how proper research, experience and training may replace some of the lost income?

Getting back to the biotech short position; Later in the session, as IBB was rising, BIS declining, the short was re-established.

More on that entry is planned for tomorrow’s discussion.

Charts by StockCharts

Note:  Posts on this site are for education purposes only.  They provide one firm’s insight on the markets.  Not investment advice.  See additional disclaimer here.

Biotech, Short Stop

It’s about 20-minutes before the open.

For those monitoring the short trade in biotech (IBB), the stop has been moved (not advice, not a recommendation) to the area around IBB, 133.11.

This is the middle of the trading range from September 23rd.

There may be orders hiding right around IBB 132.00 – 132.40 and the market could attempt to search these out.

We’ll see.

Annotated chart below:

Charts by StockCharts

Note:  Posts on this site are for education purposes only.  They provide one firm’s insight on the markets.  Not investment advice.  See additional disclaimer here.

Amgen: Strategic Reversal

Amgen (AMGN) was covered in the last update as having a wedge breakout to the downside. 

Price action then promptly reversed back into the wedge, giving the equity a new lease on life.

At least, that’s the way it looked at the time.

If we pull out to one time frame higher … the weekly, and look at AMGN, the reversal set-up and possible channel(s) are clear.

The terminating, rising wedge is there.  However, we can see several trend-line symmetries.

Taking the solid blue trend-line (right side) and bringing it backward (dashed lines), sometimes referred to as “reverse trend-line”, there’s symmetry in the AMGN set-up.

We may be witnessing the strategic reversal of AMGN which has already developed a massive trading channel.

Charts by StockCharts

Note:  Posts on this site are for education purposes only.  They provide one firm’s insight on the markets.  Not investment advice.  See additional disclaimer here.

Trending: Biotech

Today’s action may be in a trading channel.

It’s a Fibonacci eight days from the low of September 4th, to the top on the 16th.

That time correlation, along with the channel hits, help to provide validity to the set-up.

Our short position in the sector has not changed appreciably.  There was a slight backing off yesterday, by reducing the size about one-percent.

However, during today’s action as IBB was making intraday highs (BIS making lows), the short position was increased, via BIS.

In any event, we have a hard stop at the day’s high, IBB 134.85, which is approximately 31.46, on BIS:  Not financial advice, not a recommendation.

As of this post, 7:00 p.m., EST, the S&P 500 futures are trading down about -0.50%, giving the inference that downside action will continue at the next session.

Silver futures have dropped another 4.5% – 5%. Price action’s heading straight down.  Nearest chart support for the SIZ20 (December) contract is around 20.00.

Charts by StockCharts

Note:  Posts on this site are for education purposes only.  They provide one firm’s insight on the markets.  Not investment advice.  See additional disclaimer here.

Amgen (AMGN) Forecast

Now that AMGN is breaking lower, let’s take a look at how far down it could go.

The chart shows the terminating wedge pattern.  Depending on where the wedge entry is measured, slightly different projections will result.

A fairly conservative estimate is shown.

If we do not get some kind of recovery back into the wedge itself, a measured move projects to the 185-area.

A potential downside breakout was highlighted yesterday. The press as typical, appears surprised by the markets opening lower, continuing lower.

Doing what they do (fabricate a ‘reason’), AMGN’s decline seems to be a political problem … even though its been in a topping formation for years with ever slowing upward trend.

No matter, it’s all about healthcare uncertainty.  Tomorrow it may be all about something else. 

Wyckoff said over a century ago, the financial press was essentially useless at best and intentionally deceptive at worst.

A hundred years later, not much has changed.

Wyckoff analysis is one of the best kept secrets on Wall St.  We’ve been using it to spot market opportunities since 2008.  Find out more about Wyckoff analysis here.

Charts by StockCharts

Note:  Posts on this site are for education purposes only.  They provide one firm’s insight on the markets.  Not investment advice.  See additional disclaimer here.

Out of Air

Right at the danger point, biotech’s (IBB) upward energy evaporates.

The 2-Day chart below shows a series of thrust energy units.

Going from 57-Million, all the way down to less than 1-Million (0.85-M), in six trading days.

An expandable version of the chart above (with additional technical data) is here.

Note:  Posts on this site are for education purposes only.  They provide one firm’s insight on the markets.  Not investment advice.  See additional disclaimer here.

What’s Not Happening?

Ask not what the market is doing; rather ask, what is the market not doing?

It’s about fifteen minutes before the open.  Biotech (IBB) was bid/ask as high as 137.01/137.44, in the pre-market session.

As we get nearer to the open, that high mark is being eroded to 136.73/137.11. 

What’s not happening, is the market has not bid significantly higher than yesterday’s close.

If demand was strong, price action would have no problem pushing past the resistance area at 136.00.

The chart shows we’re at the danger point.  We can see symmetry created by the trading range. 

It is ten points from here to the top (all time high). 

At the bottom of the range, it’s ten points down to the untested breakout, support level.

The Fed announcement is scheduled for 2:00 p.m. EST and trading may just tread water until that time.

Charts by StockCharts

Note:  Posts on this site are for education purposes only.  They provide one firm’s insight on the markets.  Not investment advice.  See additional disclaimer here.

Break & Test: Biotech

Getting out of a non-performing position allows the mind to clear.

What we see now, is a massive terminating wedge pattern for IBB. 

That wedge had a trend line break September 3rd, on decisive volume.

The break is now being tested.  This is typical market behavior. Expandable chart of IBB, is here

It’s about thirty minutes before the open and pre-market activity shows IBB trading higher. 

The IBB, 50% retrace level is approximately ~ 136.20

IBB tends to move counter-trend during the first two hours of trade. 

If the trend is down and the market’s just testing, the (continuation) reversal lower may come around 11:30 a.m. EST.

Inverse funds (not advice, not a recommendation) are BIS (2X-inverse) and LABD (3X-inverse).

Charts by StockCharts

Note:  Posts on this site are for education purposes only.  They provide one firm’s insight on the markets.  Not investment advice.  See additional disclaimer here.

CORN: Breakout Higher

The agricultural food supply, and delivery systems are being destroyed systematically.

The fundamental picture for corn at this juncture, should be well known. 

Weather events, whether manufactured or not, are taking out huge (silo) stockpiles in addition to destroying what’s still in the fields.

The August 20th, update highlighted a CORN trend-line.

Since then, CORN price action has morphed into a trading channel.

We’re now at the right side and in position to move higher. A channel failure at this point would be obvious.

If CORN does not continue upward from here, the channel has lost its effectiveness and/or, the market has some other objective.

Biotech IBB: Update

Anything can happen. Price action reversed above the 23.6%, retrace, hit the 38.2% retrace and kept going.

Our result was to exit the (IBB), short position during today’s session.

We’re past the 38% retrace level which leaves 50% and 61.8%; Trading action is to stand aside (not advice, not a recommendation) for now.

Charts by StockCharts

Note:  Posts on this site are for education purposes only.  They provide one firm’s insight on the markets.  Not investment advice.  See additional disclaimer here.