Downside Leader?

Biotech XBI, spent the last three months hitting resistance, going nowhere.
That doesn’t mean there weren’t trading opportunities; there were but the big (expected) break to the downside never came … that is, until now, maybe. 🙂
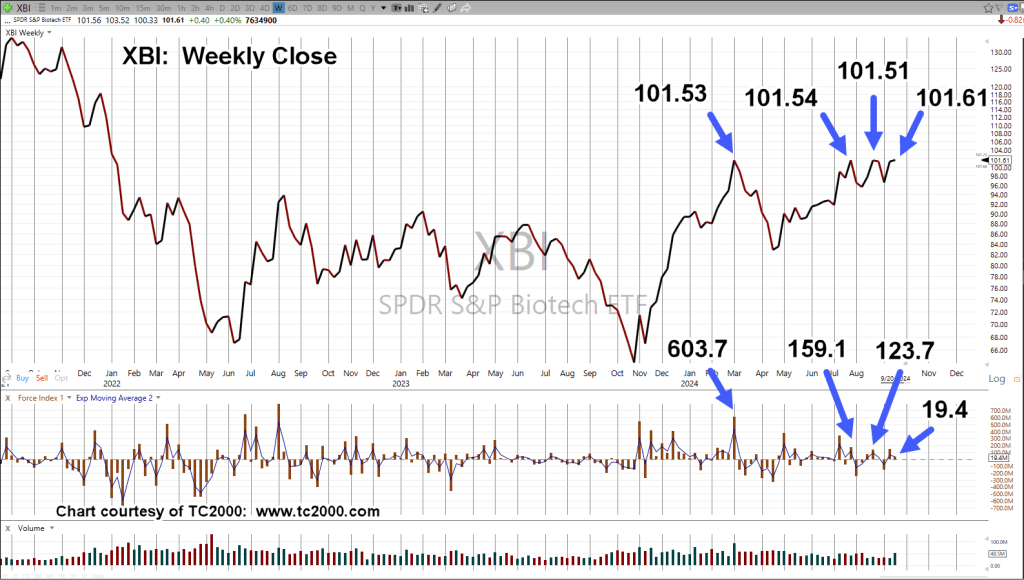
Looking at the weekly chart, it’s completely different from the current, topping, on-going A.I. mania.
Biotech reached its all-time high, years ago.
Biotech XBI, Weekly Close
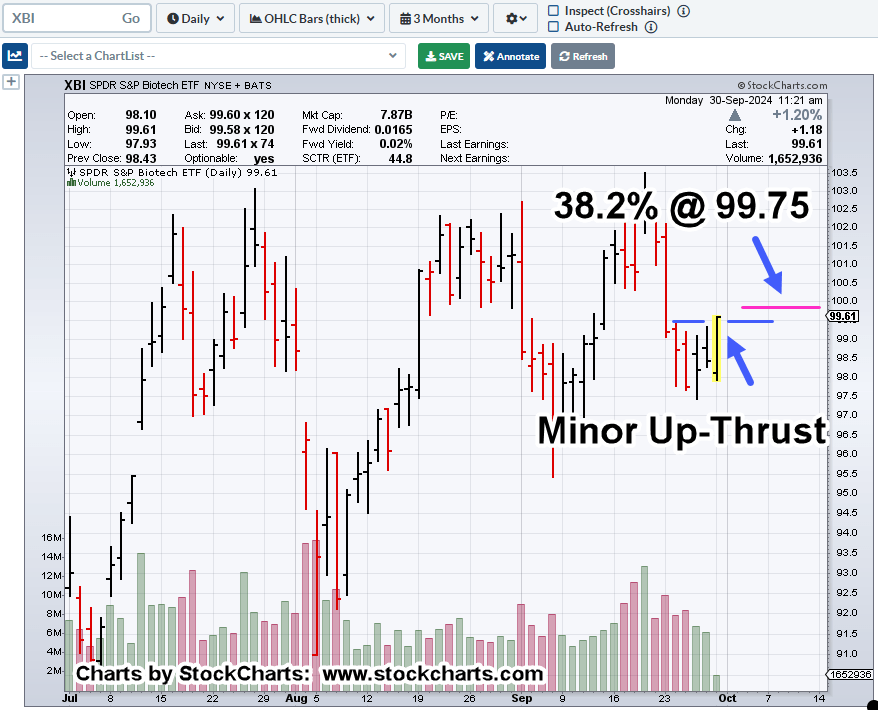
The sector’s been retracing to Fibonacci 38.2%, since late February, this year.

Moving in closer to the daily, the last three (short) trades in the sector are noted (not advice, not a recommendation).
Biotech XBI, Daily
For detail on how and why trades were selected, click on the side bar for that trade number.
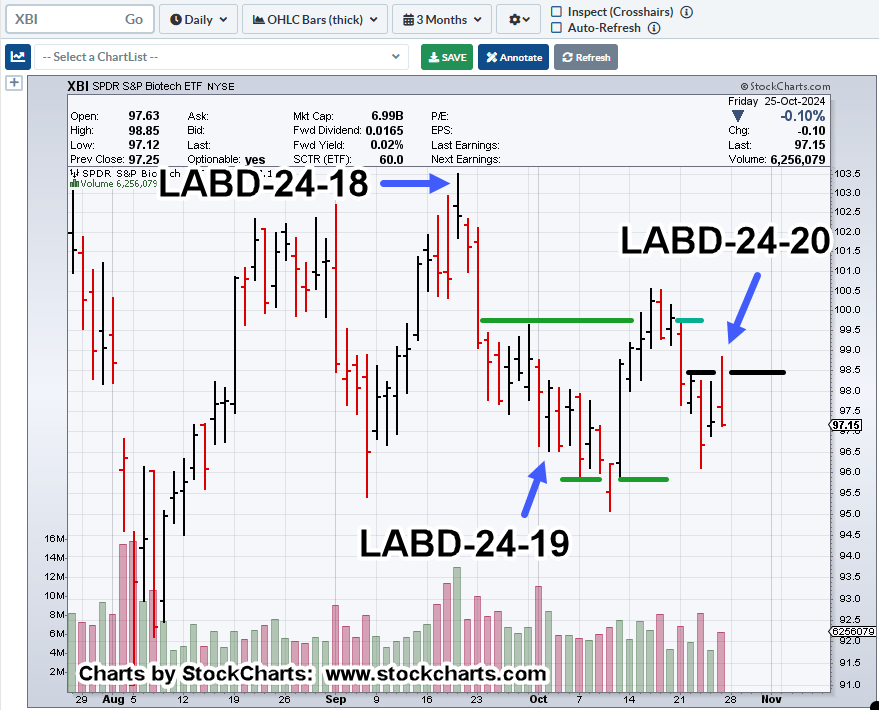
Note: We have a repeating pattern (between green lines) of ‘spring-to-up-thrust’.
The Week Ahead
Anything can happen.
With that said, ‘normal’ market behavior would be a ‘blip’ upward to test resistance, the black line.
However, there’s no requirement to do so.
If price action gets above Friday’s high, obviously it’s time to exit (not advice, not a recommendation).
Stay Tuned
Charts by StockCharts
Note: Posts on this site are for education purposes only. They provide one firm’s insight on the markets. Not investment advice. See additional disclaimer here.
The Danger Point®, trade mark: No. 6,505,279