That’s the training given by the late David Wies years ago concerning springs and up-thrusts.
His inference, if the volume contracts on the pull-back, the set-up has been tested; resumption of the reversal (up or down) is now expected to continue in earnest.
More analysis to follow but that’s where Newmont looks to be at this juncture.
Both gold (GLD), Newmont (NEM), and the miners (GDX), are at the danger point.
At this juncture, price action distance to trade failure or continued sucess is quite small (not advice, not a recommendation).
Note: Posts on this site are for education purposes only. They provide one firm’s insight on the markets. Not investment advice. See additional disclaimer here.
Founded by William Boyce Thompson in 1916, Newmont (NEM) was around over a century ago during Livermore and Wyckoff’s day.
Thompson is center in the photo with President, Warren G. Harding at left.
Wyckoff and Thompson were interconnected.
In Wyckoff’s autobiography, he writes about working for Thompson’s firm (Thompson, Towle & Co.) in 1910.
During that time, he describes no fewer than two stock ‘manipulation’ schemes; one by renowned James R. Keene and the other by Thompson himself during a deal-gone-bad with the Guggenheims.
Also in 1910, Wyckoff published his seminal work: Studies In Tape Reading. If there’s any one book to read concerning how markets work, ‘Studies ..’ is that book.
Wyckoff had first-hand exposure into market operations by the wealthy and super wealthy. More importantly, he saw how those transactions showed themselves on the tape.
Last check, a first edition ‘Studies’ went for around $3,500. A quick search as of this post, turns up nothing currently available.
For those who complain ‘it’s rigged’, to that we can say, ‘it’s always been rigged’.
Determine what those ‘rigging’, are trying to accomplish and you may have a trade.
Now, to the market at hand: Newmont Mining.
It’s the key; the largest cap equity in the Senior Mining Index (GDX).
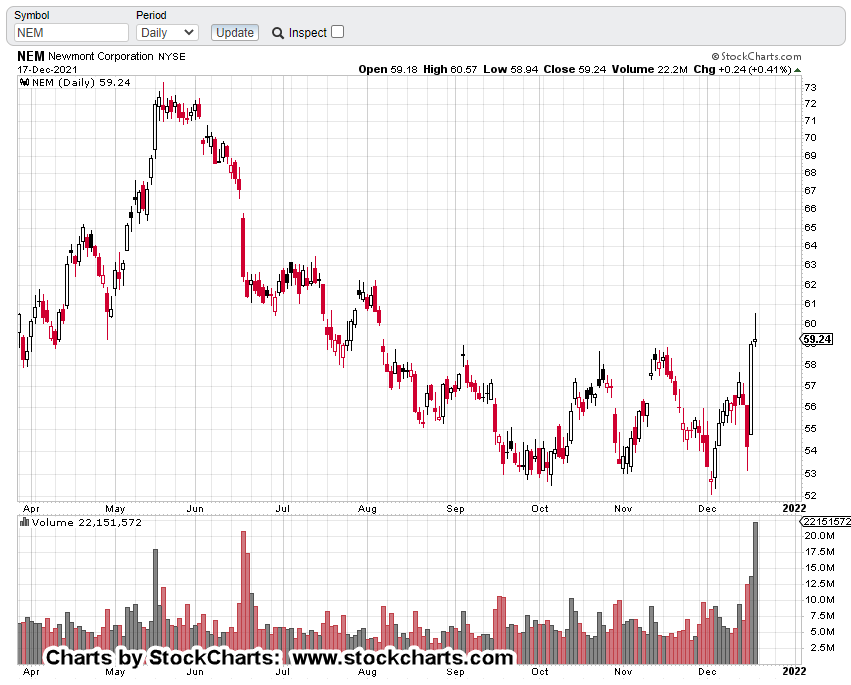
Newmont, NEM
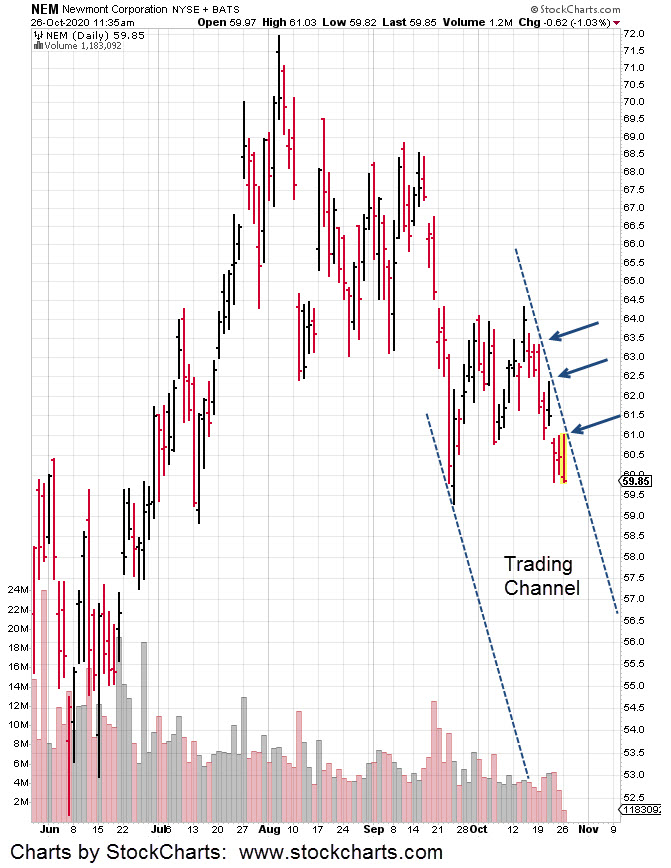
The daily chart:
For those who have been with this site for a while, you may instantly see the set-up: Spring to Up-Thrust.
The marked-up chart makes it clear.
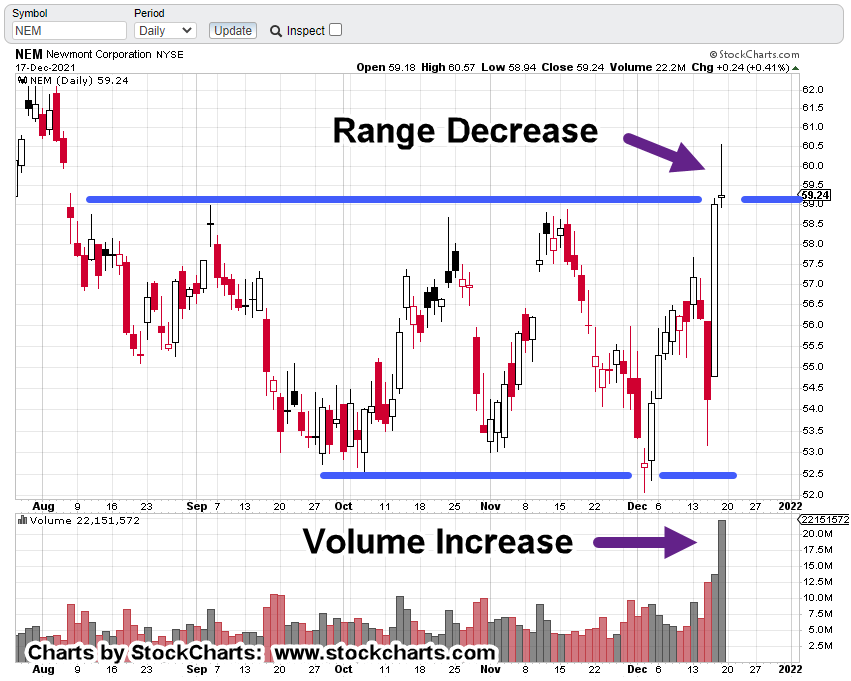
Moving in a little closer for additional clues:
We can see from the volume itself, there were a huge number of transactions this past Friday.
NEM penetrated long established resistance.
In so doing, it set off a massive number of orders: Buy orders, sell orders, sell-short.
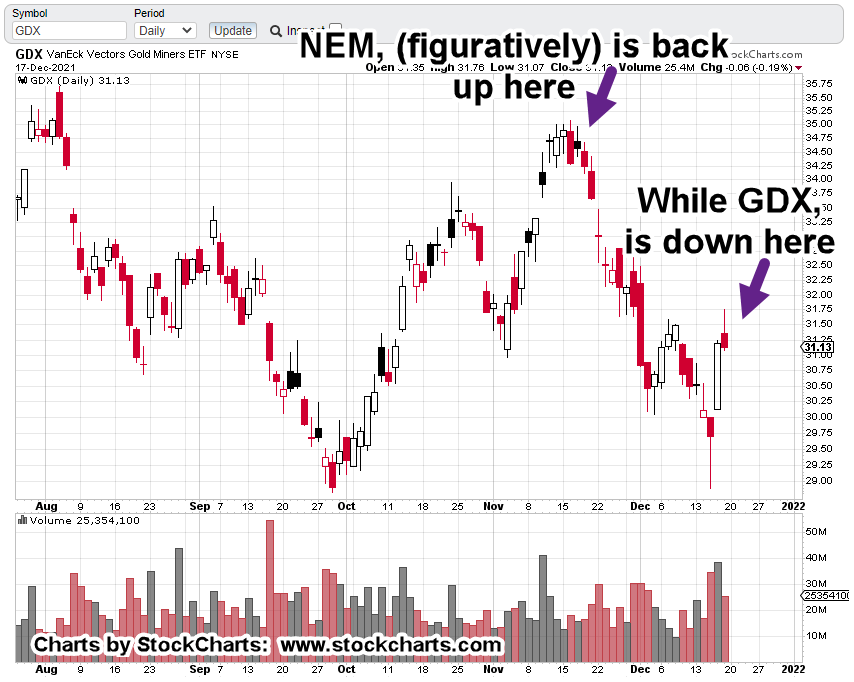
Senior Mining Index: GDX
The other part of the story and the one that weights it to the bears:
While NEM, is at multi-month highs, senior miners GDX, is nowhere near its highs.
Daily chart, GDX:
What does that mean?
It means the market is ‘thinning-out’
The professionals and maybe some investors alike, are abandoning the non-performing lesser cap equities; pouring funds into the last man standing NEM, in hopes that it will keep moving higher.
It’s desperation and signals market weakness.
As always, anything can happen and bulls may somehow take control.
However, from the charts themselves, hyper-stretched major indices coupled with insiders bailing out the most in history, uneducated ‘retail’ willingly stepping up to hold the bag, it does not look good for any bulls … gold or otherwise.
Summary:
We could find ourselves in a situation similar to the oil market in mid-2014 where it spontaneously deflated for eighteen months … nary a blip higher all the way down.
With that, we’re maintaining short via DUST (not advice, not a recommendation).
Note: Posts on this site are for education purposes only. They provide one firm’s insight on the markets. Not investment advice. See additional disclaimer here.
If there’s any take-away from 2020, it’s that anything can happen.
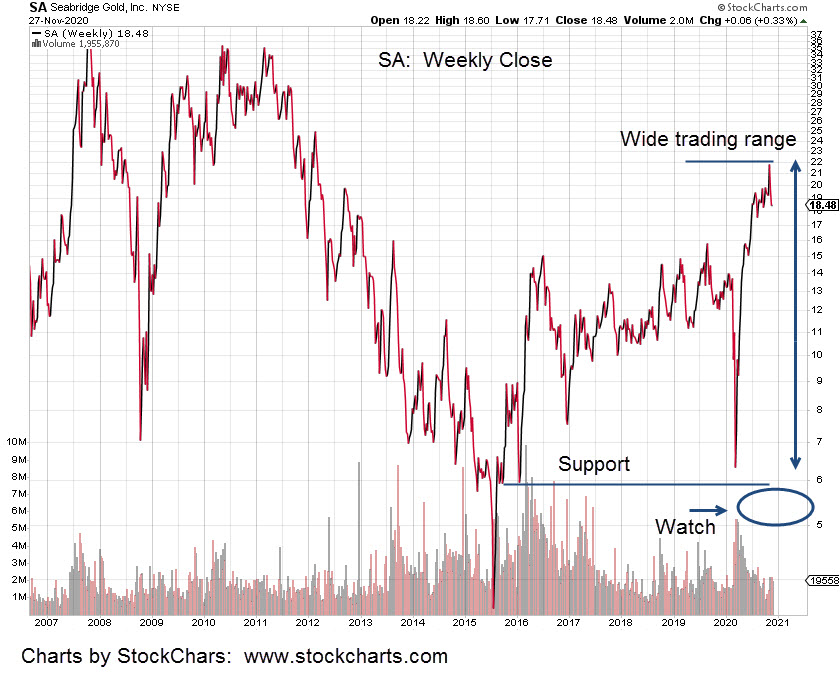
Recent SA price action shows a wide trading range with high volume.
Typical market behavior is to come back and test.
Looking at SA from a relative strength perspective, we have the top three majors (GDX) listed in terms of the highs in August, to most recent lows:
The three majors are ‘officially’ in bear markets while SA is hanging just above the – 20% level.
On a relative scale, looking at price action, SA is reluctant to head lower. It’s exhibiting relative strength.
If and when the markets (S&P, Dow, NASDAQ) reverse in earnest, there’s likely to be wide spread panic. Just like last time and probably worse.
It’s the person (or entity) that keeps their head under such conditions that has potential to establish long-term, low risk positions.
As a side note: If and when we get there (panic selling), and if SA pushes below well established support (6-area), the initial plan is to open a major long position … but with a significant caveat.
That caveat is: We’ll take possession of the actual physical shares (not advice, not a recommendation). The broker could put up a fuss and charge a fee. So be it.
The world economic forum has already stated, the next “planned” event will be cyber attack.
Note: Posts on this site are for education purposes only. They provide one firm’s insight on the markets. Not investment advice. See additional disclaimer here.
The JDST trade, discussed over the past several weeks has been closed as of today.
Price action in the Junior Mining Index, GDXJ, declined sharply during the day but failed to decisively penetrate support at the 52.00 area.
Combined entry price for three separate JDST entries (9.98, 10.38, 10.58) was 10.19. Exit price was 12.09.
Since the short trade was executed with the leveraged inverse fund JDST, we’re not going to wait around to see what happens next.
Inverse funds have a habit of ‘blowing up’ as happed with this exact fund just a few months ago.
These vehicles are absolutely not for the novice and even the experienced pro can get impaled on them every now and then.
In fact, the last substantial trade in JDST was closed out on March 12th, 2020. That exit was just two days before the fund had its monster disconnect. Enough said.
On a separate note; because of the price action and position of NEM, it’s now in Wyckoff spring position. It thus has the potential to move higher from here.
Note: Posts on this site are for education purposes only. They provide one firm’s insight on the markets. Not investment advice. See additional disclaimer here.
Note: Posts on this site are for education purposes only. They provide one firm’s insight on the markets. Not investment advice. See additional disclaimer here.
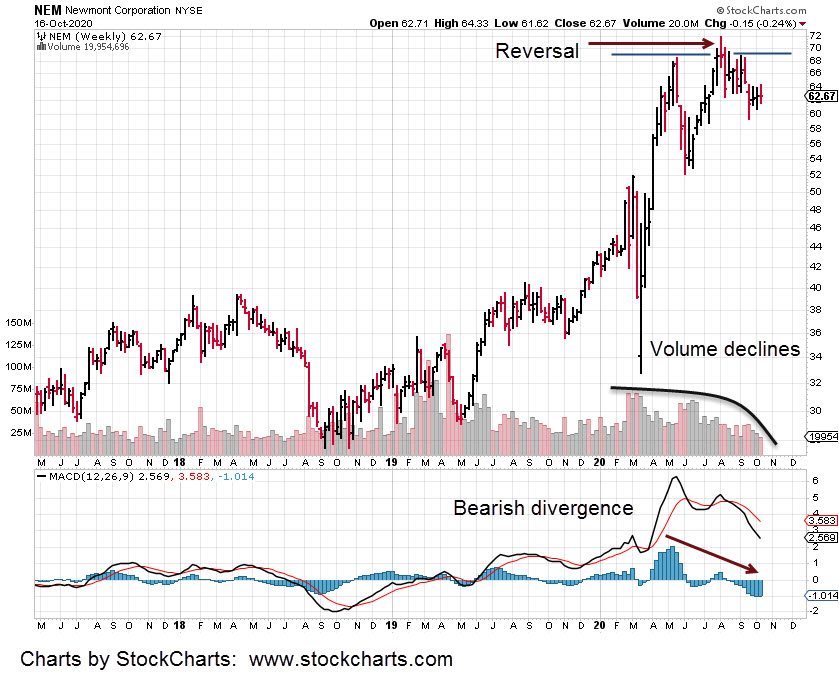
The entire precious metals sector may be about to take an unexpected hit.
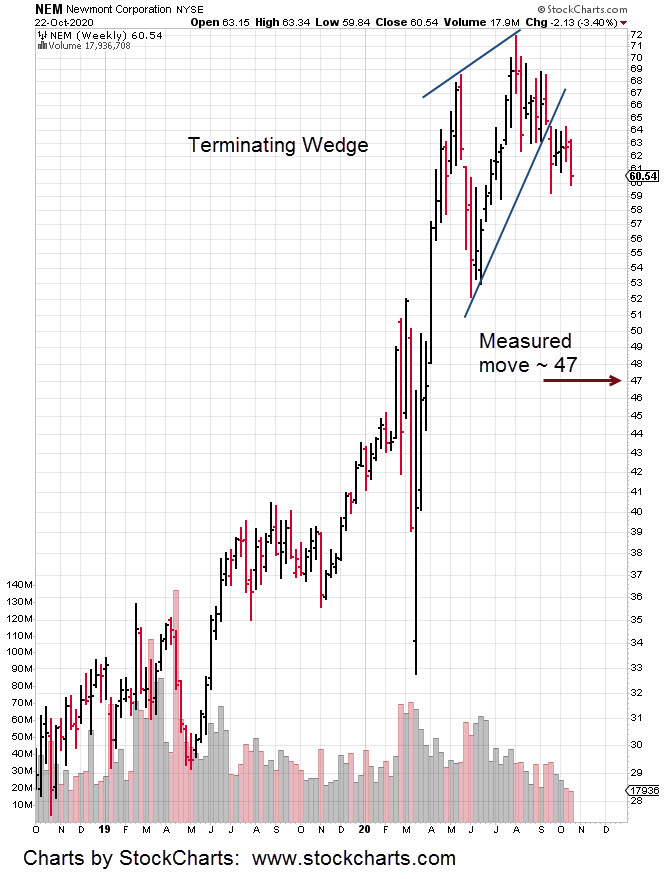
Prior updates have discussed the Newmont (NEM) bearish divergence and reversal. This update shows a rising wedge breakout to the downside.
Using standard analysis techniques on the chart below, we get a measured move to the vicinity of 47 for NEM.
A decline of that magnitude, a drop of over 22%, may be the catalyst for a whole other bearish scenario.
Just based on empirical observation and analysis generally available (YouTube, et al), it’s pretty safe to say that no-one is prepared for a significant decline.
Well, almost no-one. As reported back in late September, the only YouTube analyst (that was located) proposing the idea of a decline was Sajad, in this report.
Note: Posts on this site are for education purposes only. They provide one firm’s insight on the markets. Not investment advice. See additional disclaimer here.
When in an uptrend and prices start to flag, it’s a warning that energy is lost.
The Newmont update showed the heavy hitter was in a reversal. That update gave specifics on how or when the reversal would be negated (and back into an uptrend).
It’s not happening. The upside hasn’t showed … or, at least not yet.
The next trading day, Newmont (NEM) lost 1.5%. The day after that (yesterday), was another down day with a loss of nearly 1%.
Today, NEM is attempting to move higher. However, the weekly bar is still in reversal.
The mining indexes themselves are not so clear. The junior index with its weekly chart below, has it reversing last week and now attempting to move higher.
It’s losing steam. It’s no secret that failed moves can be the most dynamic of all price action.
The market is ‘supposed’ to go one way … in the case of the silver/gold miner’s, they’re supposed to be moving higher; Hyperinflation and everything, right?
What if everyone’s on the wrong side of the trade?
What if the expected hyperinflation is years away?
This juncture right now, appears (not advice, not a recommendation) to be a low risk area to go short.
In the case of the junior index GDXJ, if price action closes up for the week, the bull market may continue.
If not, and GDXJ closes down for the week, the up-trend looks like it’s failing and the entire sector could fall apart.
Note: Posts on this site are for education purposes only. They provide one firm’s insight on the markets. Not investment advice. See additional disclaimer here.
Note: Posts on this site are for education purposes only. They provide one firm’s insight on the markets. Not investment advice. See additional disclaimer here.