Margin of Error

If you’re upside down in a diving stall, shown here, there’s no margin for error or you’re dead; literally.
The big problem for engineers, it doesn’t work that way in the markets.
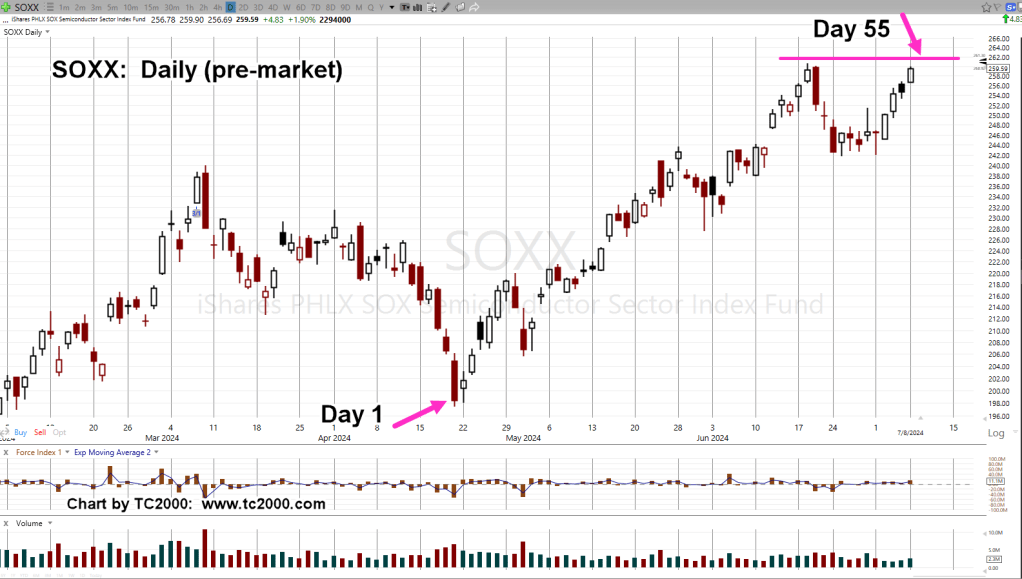
Two days after this post, we have a potential reversal in the SOXX (not advice, not a recommendation).
Of course, the engineers have long since left the room as there was an ‘error.’; not getting the (potential) reversal exactly right.
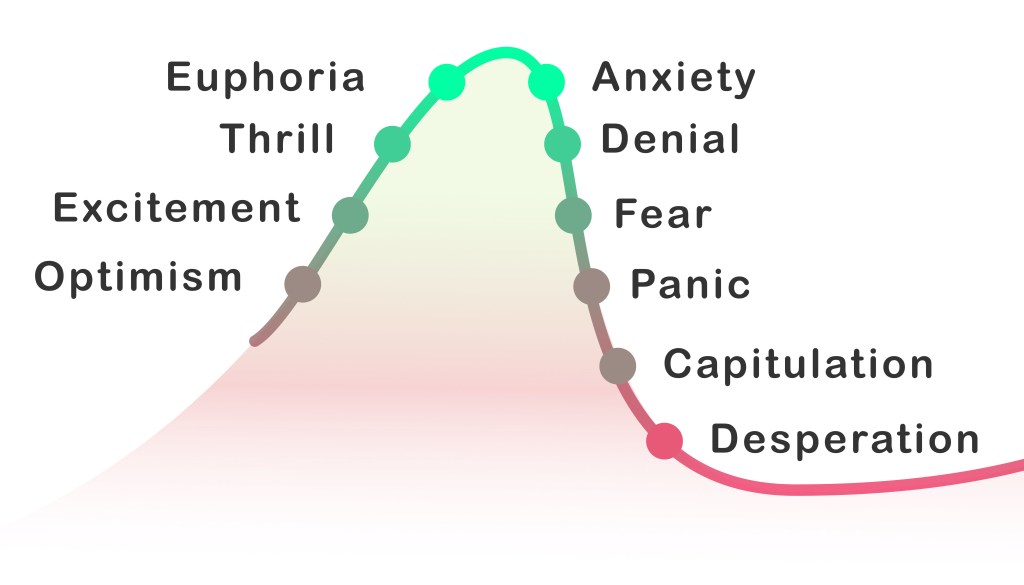
If the AI mania is over, that update two days ago was off by two-days; the biggest bubble in world history … at least since the South Sea Bubble.
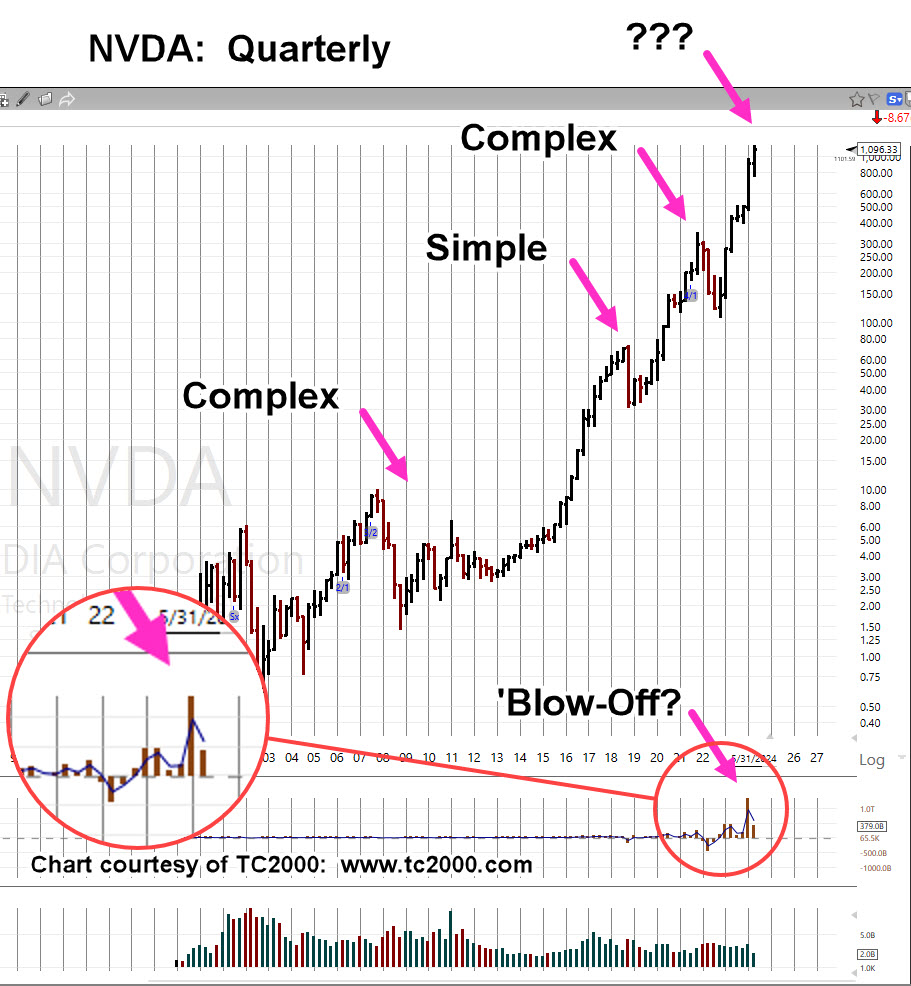
So, let’s move on to the chart.
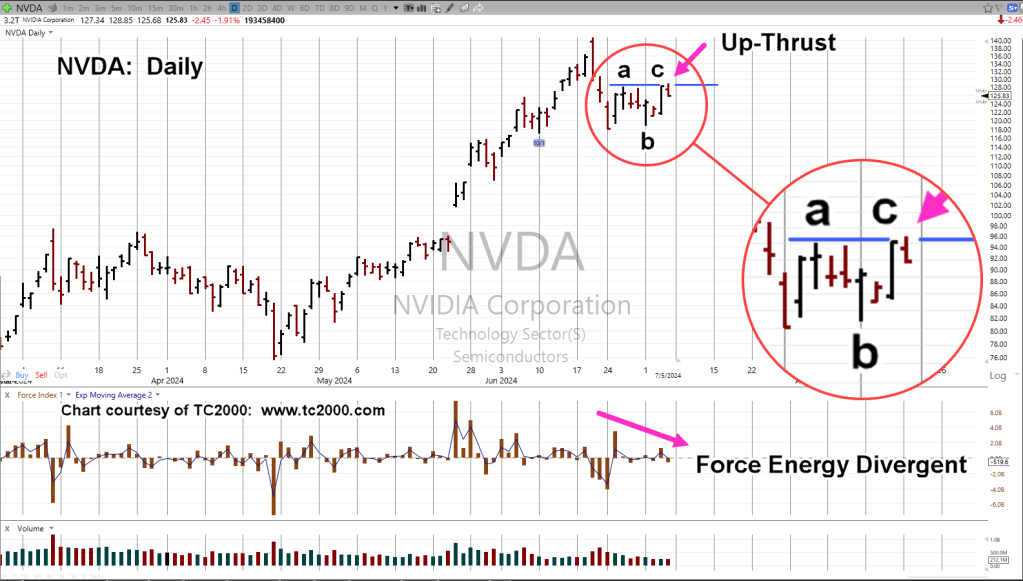
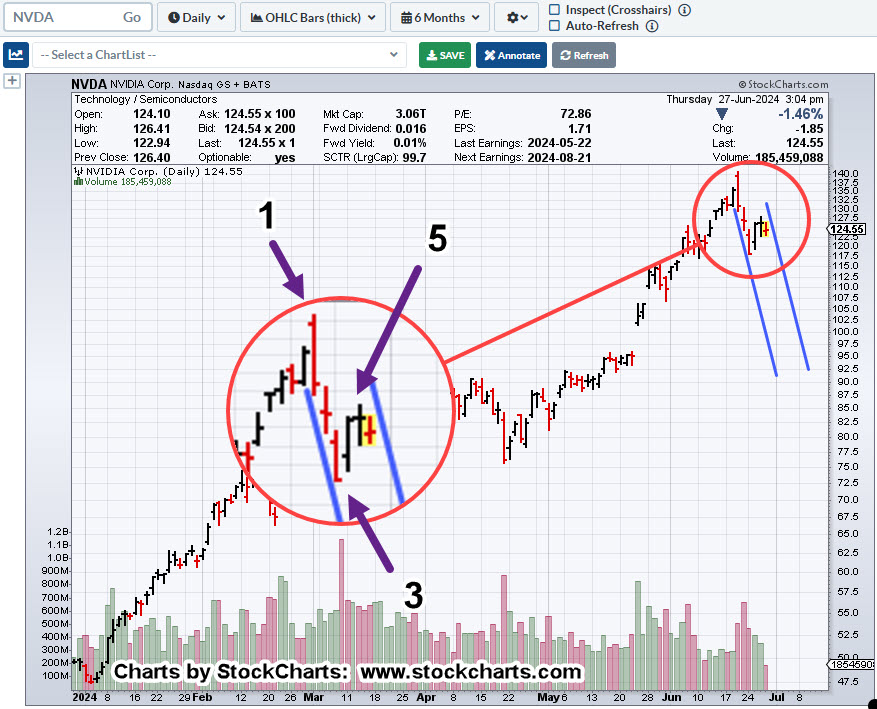
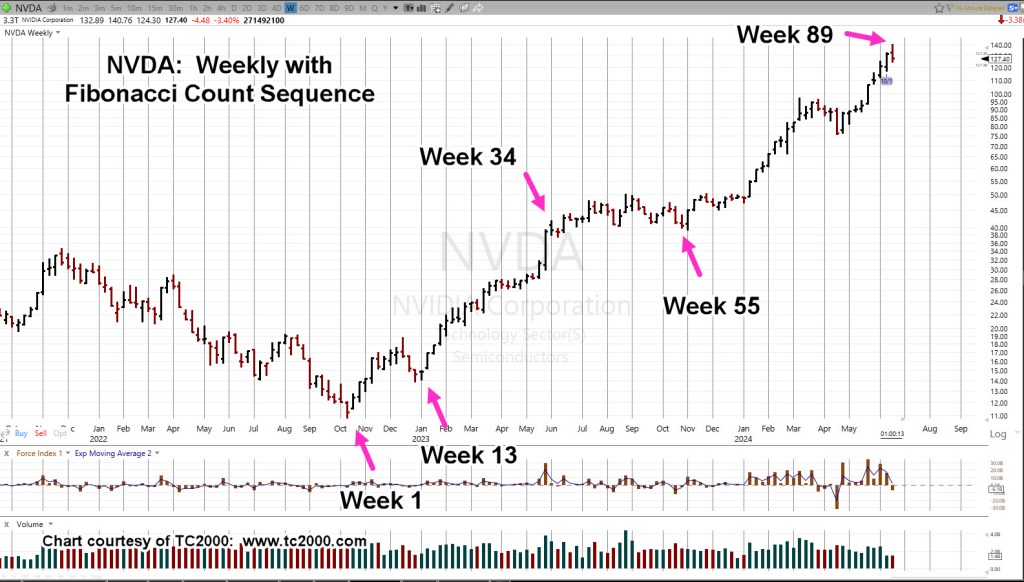
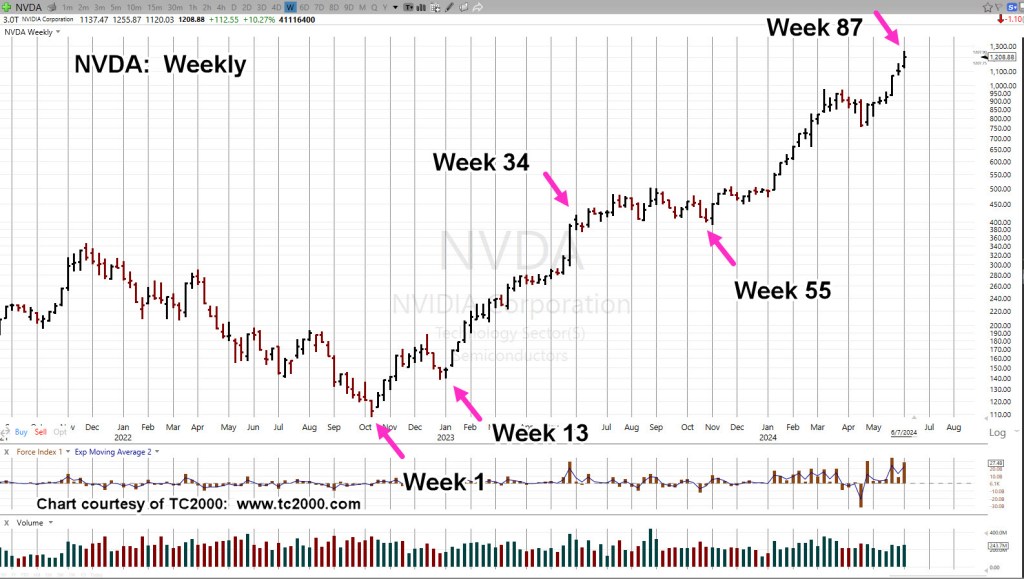
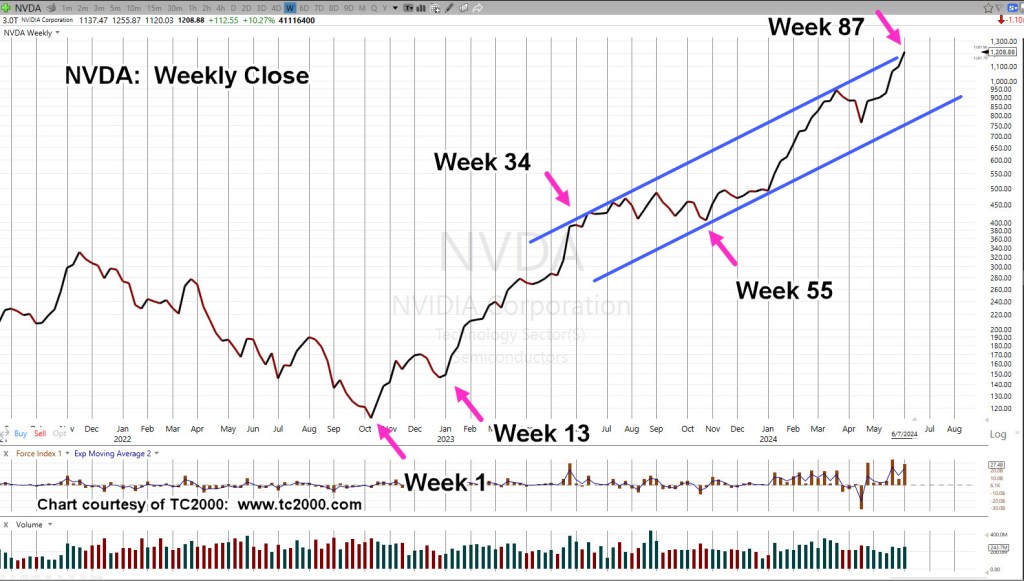
Before we get started, also note, Nvidia has not made a new (all-time) high. This update identified that reversal correctly (so far).
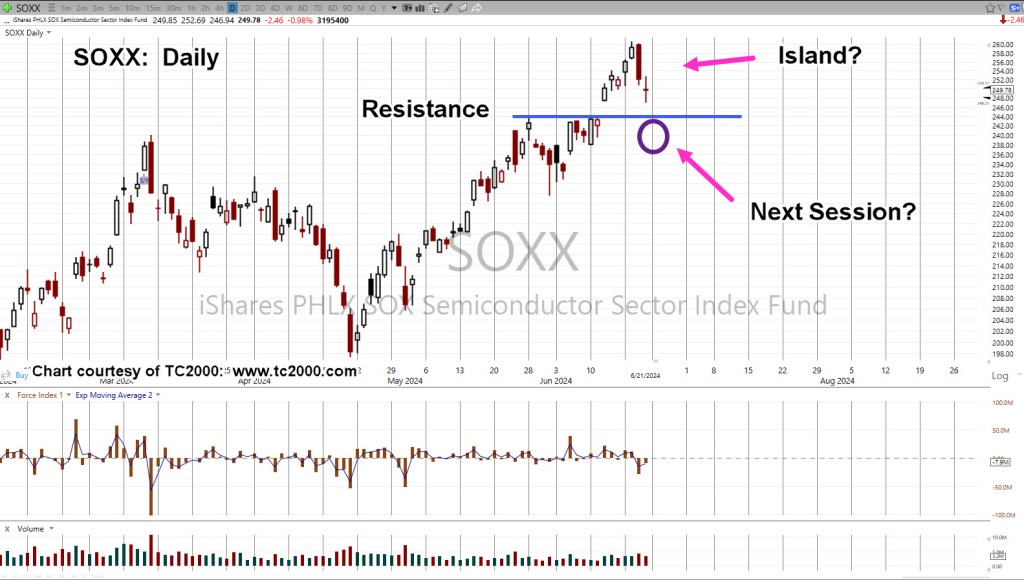
Semiconductors SOXX, Daily
As of 11:05 a.m., EST, the SOXX has posted out-side-down.
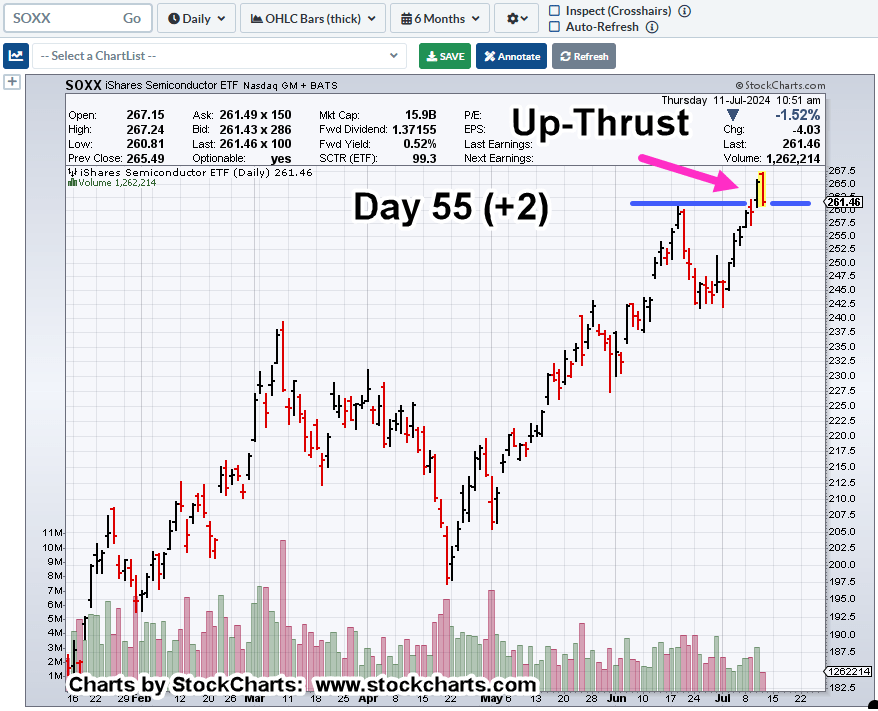
When Fibonacci counts get longer, there is more room to be off by a few days.
If this is the reversal for the SOXX, a two-day margin is fully acceptable (not advice, not a recommendation).
Stay Tuned
Charts by StockCharts
Note: Posts on this site are for education purposes only. They provide one firm’s insight on the markets. Not investment advice. See additional disclaimer here.
The Danger Point®, trade mark: No. 6,505,279