Interesting Numbers
Trading professional Tom Hougaard has already told us, if Friday’s market action trades below the prior day, Thursday, then Monday tends to be lower as well (not advice, not a recommendation).
There’s a lot going on in the S&P chart below.
S&P 500 SPY, Daily
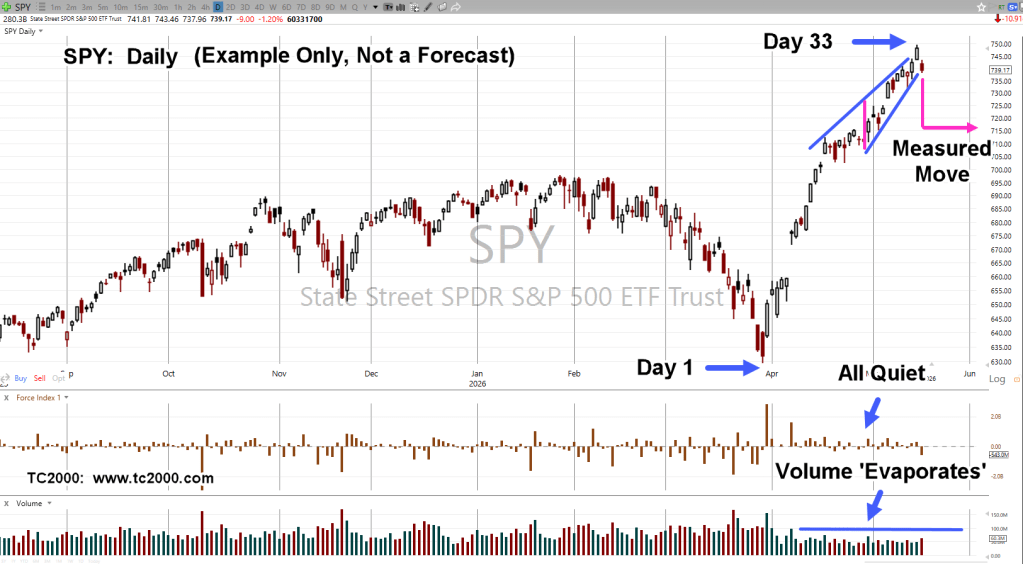
The current move bottom-to-top, was 33 Days
If the SPY retraces from Friday’s close to the ‘Measured Move’ target, it’s a drop of approximately –3% (not advice, not a recommendation).
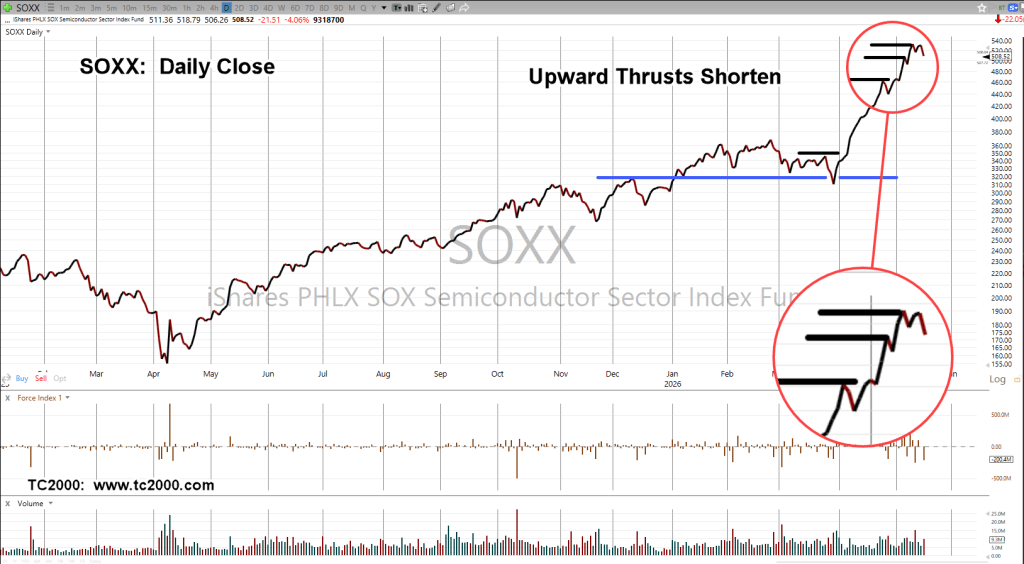
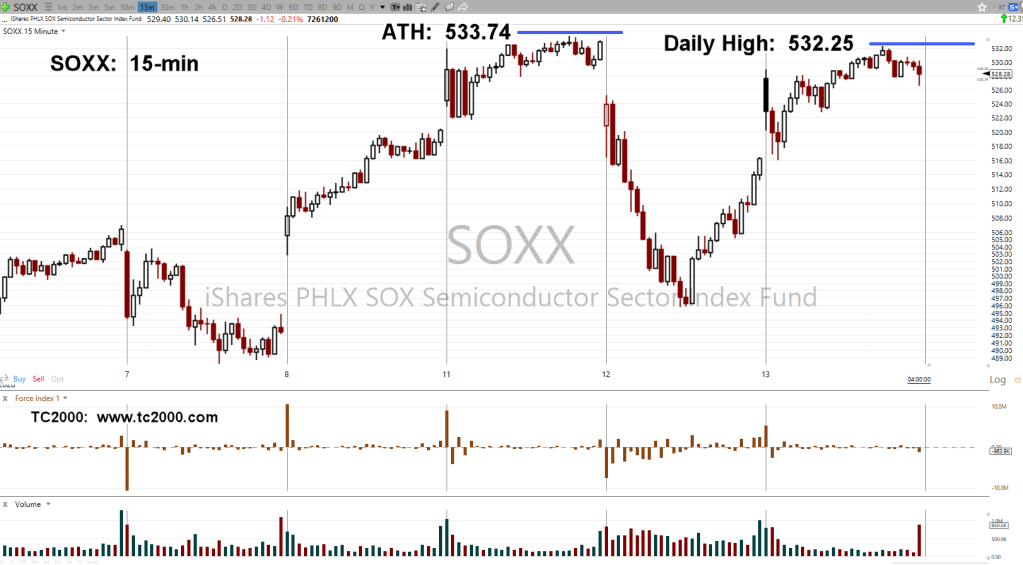
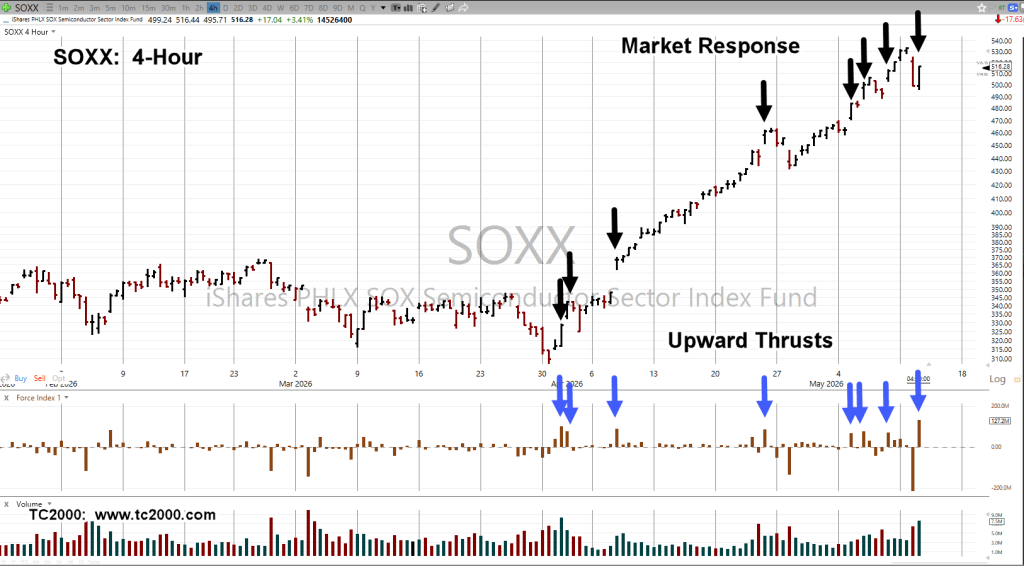
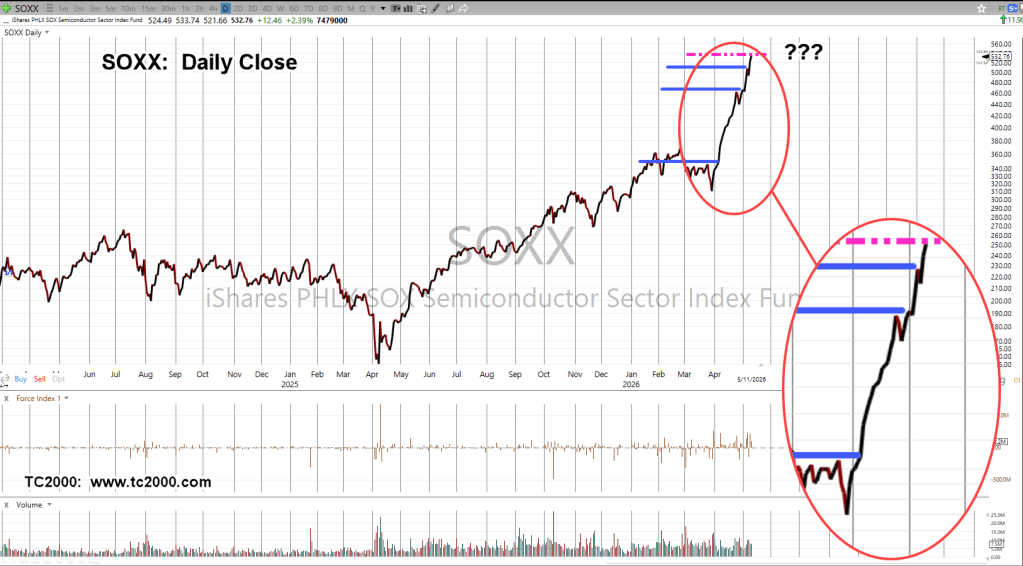
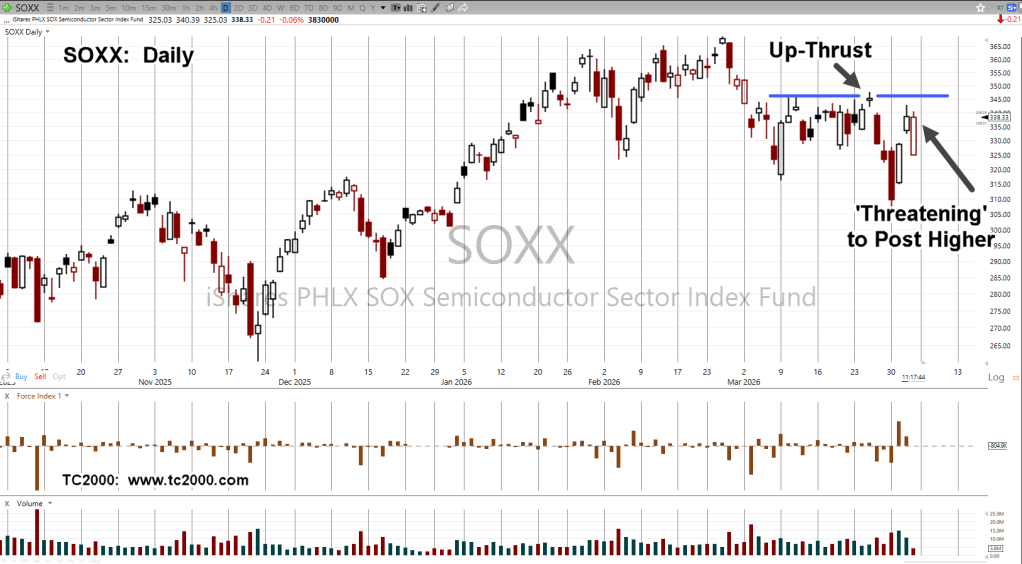
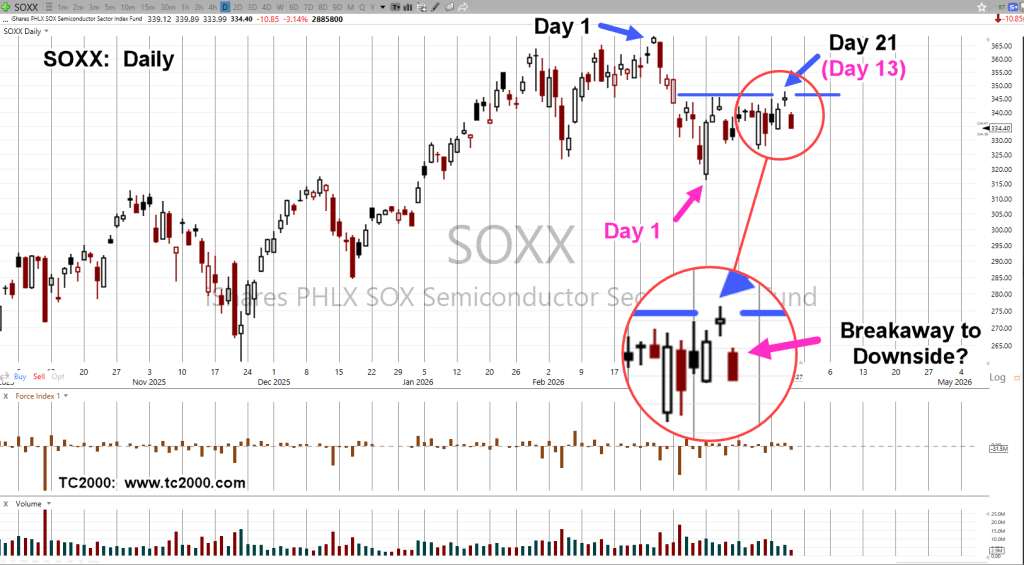
Let’s throw in some SOXX, stats as well.
SOXX all-time high (5/11), was 533.74. The ‘test’ high (5/14), was 533.13, closing at 530.03, a daily gain of +0.33%.
Stay Tuned
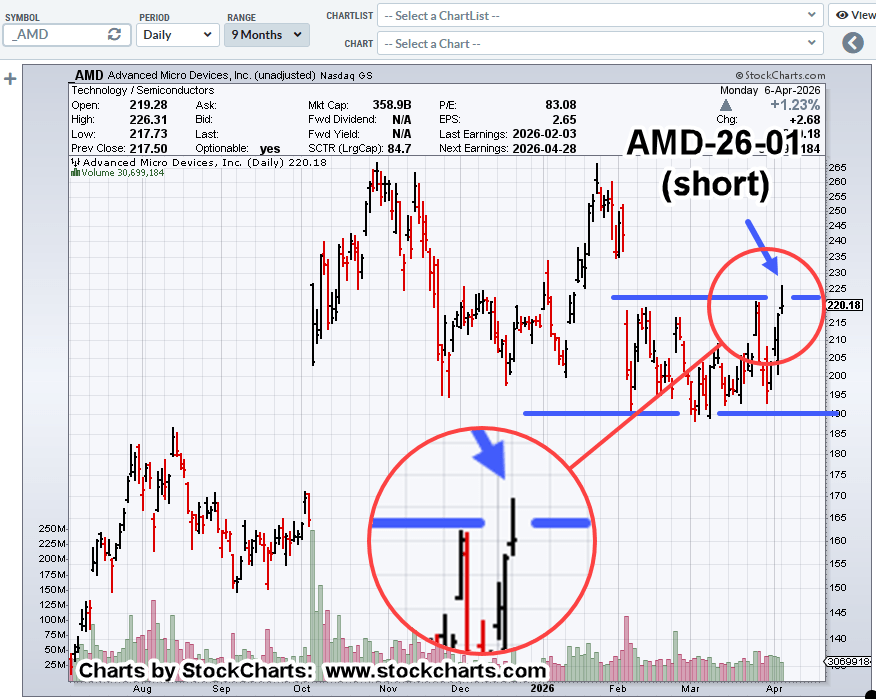
Charts by StockCharts
Note: Posts on this site are for education purposes only. They provide one firm’s insight on the markets. Not investment advice. See additional disclaimer here.
The Danger Point®, trade mark: No. 6,505,279