10:49 a.m., EST
Biotech Gap Lower, Expected
Fibonacci Day 8
Last Stop Before Chaos?

This morning’s gap lower in SPBIO (LABD higher) was fully expected.
Expected as well, is the retrace in progress as of this post.
Today, is Fibonacci Day 8 from the LABD, pivot low of June 28th.
Biotech (SPBIO) has posted a fantastic time sequence on the daily as well as the weekly.
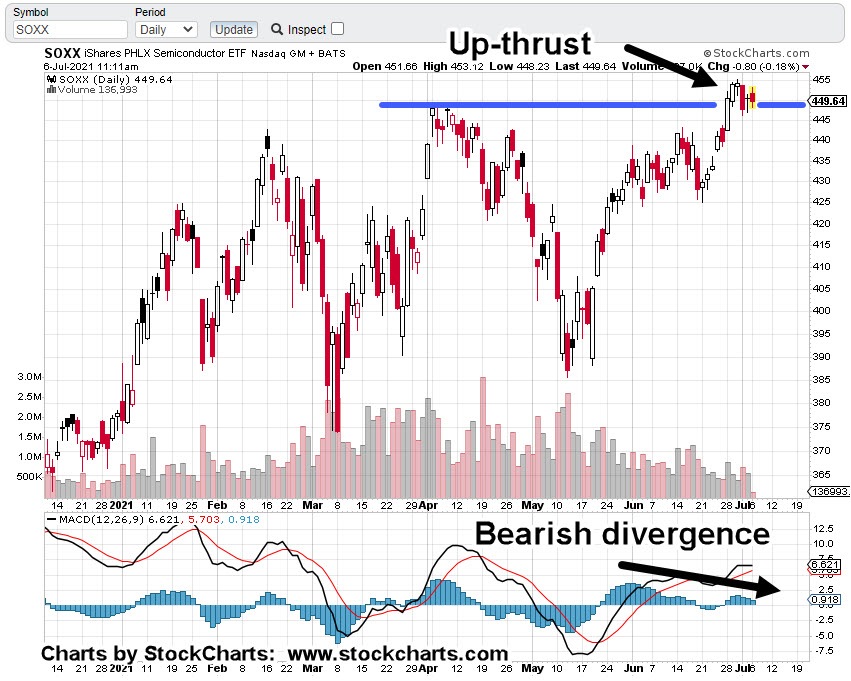
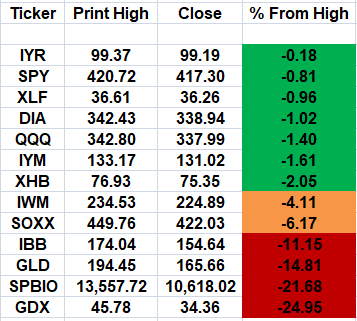
The gap-lower open in the S&P (more so for SOXX) has everyone sharpening their pencils; wondering, if ‘this is it?’.
It could be.
However, with attention now focused on potential downside, the clean Fibonacci sequences are likely to morph into chaotic movement.
The time for low-risk short positioning (not advice, not a recommendation) in this sector may be coming to an end.
Looking at inverse LABD, and using the Fibonacci retrace tool, it’s likely price action will retrace to at least the 38%, level.
At this point, it’s already close:
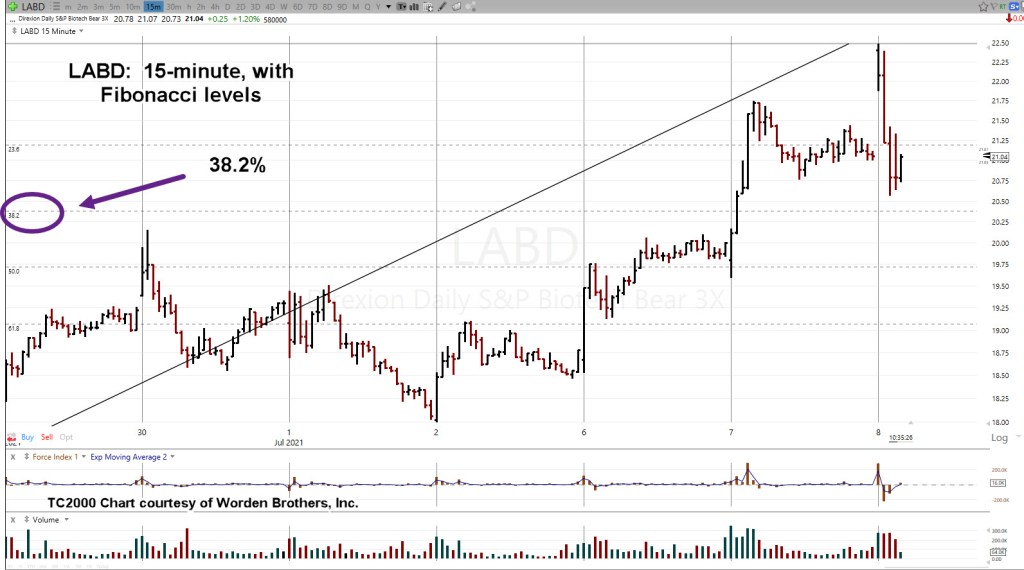
The inverse biotech LABD, 15-minute chart (above) shows we’re near the 38%, level.
After today, the expectation is for price action to become SPBIO downside chaotic … long enough to frustrate the late-comers to the sector.
After that, and however long that is, price action may once again become orderly.
Stay Tuned


 That’s the direction of the Dow Jones 30, the S&P 500 and the Russell 2000.