Note: Posts on this site are for education purposes only. They provide one firm’s insight on the markets. Not investment advice. See additional disclaimer here.
No matter what happens from here, Boeing has met conditions of a repeating set-up: Spring-to-Up-Thrust (not advice, not a recommendation).
A ‘set-up’, does not guarantee anything.
It just means, market behavior is such, there’s a potential for correlated (i.e., directional) movement.
The last update said there was a possibly of ‘spring failure’.
It gave specific conditions for potential failure … neither of which, happened: BA, did not open lower that day and the weekly low, was not penetrated.
All of which, brings us to now.
Early this session, BA, launched into up-thrust condition as the ‘result’ of news, link here.
Forecast In Advance
It’s important to note, potential for today’s move was forecast with this update, including upside target.
That forecast had nothing to do with ‘news’, but everything to do with how markets (tend to) behave.
So, here we are. 🙂
Boeing, BA, Daily
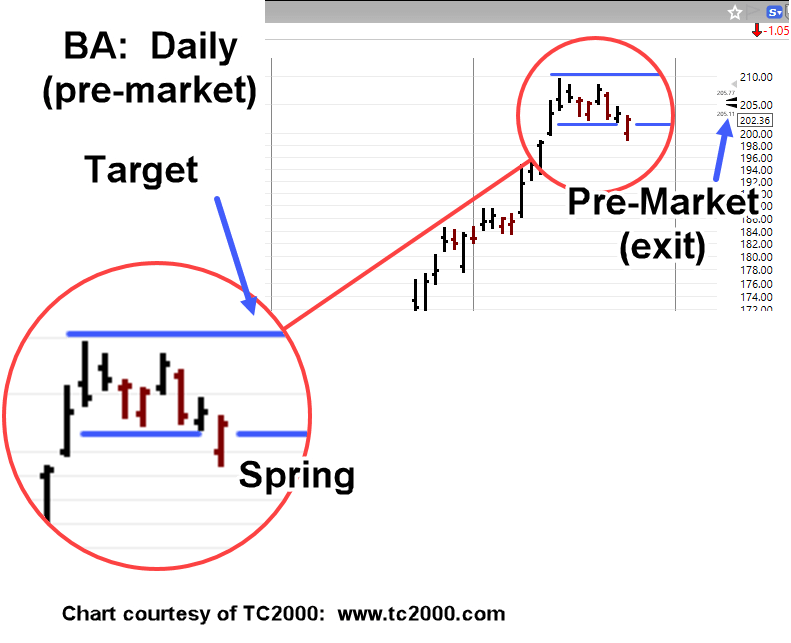
Penetration of the target area creates an up-thrust. On the daily we have ‘spring-to-up-thrust’.
Not only is the daily a repeating set-up, but the weekly is as well, shown here.
Problems, A-Plenty
The problems for Boeing have not disappeared.
The CEO hinted at this, when he clarified his comments at the conference (paraphrasing):
‘Moments later, he corrected himself and said he wants to ‘get ready’ for production ramp-up, in hopes to meet (target) production levels’
One doesn’t decide to instantly ramp up production and then ‘poof’, it happens.
Note: Posts on this site are for education purposes only. They provide one firm’s insight on the markets. Not investment advice. See additional disclaimer here.
Price action ‘failures’ provide and edge in market positioning.
In the case of Boeing (BA), from yesterday’s post, we’re expecting continued move higher off the ‘spring’ set-up.
So far, it hasn’t happened.
Instead, BA closed lower for the day; in the pre-market today (7:28 a.m., EST), it’s trading within ticks of that close.
So, what does it mean?
If, BA opens below yesterday’s low (200.88), we have a possible spring failure in the making; especially so, if price action prints a new weekly low, below 198.75 (not advice, not a recommendation).
Boeing BA, Daily
As this post is completed, BA is trading at 201.15, just slightly above the close of yesterday.
Note: Posts on this site are for education purposes only. They provide one firm’s insight on the markets. Not investment advice. See additional disclaimer here.
It’s never fun to wake up ‘in-the-red’ but that’s where Boeing BA-25-02 (short) was in the pre-market.
Based on the chart, with Friday’s lower close, price action had one of two choices; post lower and continue the decline or push higher from the spring set-up as shown.
Looks like we’re set-up to see if the (up-thrust) target area is met (not advice, not a recommendation).
With that said, the short was exited pre-market with an overall loss of 0.99%.
Boeing BA, Daily (pre-market)
Note, from the high on 5/14, to the low, last Friday, is Fibonacci 8 Days.
If the correlation remains intact, we’ll be looking for a potential target set-up, on Fibonacci Day 13.
Note: Posts on this site are for education purposes only. They provide one firm’s insight on the markets. Not investment advice. See additional disclaimer here.
Note: Posts on this site are for education purposes only. They provide one firm’s insight on the markets. Not investment advice. See additional disclaimer here.
Note: Posts on this site are for education purposes only. They provide one firm’s insight on the markets. Not investment advice. See additional disclaimer here.
Note: Posts on this site are for education purposes only. They provide one firm’s insight on the markets. Not investment advice. See additional disclaimer here.
Bear markets are not (always) prices going straight down, a la 1987.
Bear markets are ‘price destruction’; a series of ups and downs that effectively drain (whipsaw) the typical market account.
The last two weeks have seen record breaking extremes; the latest being this update, indicating the market posted the largest volume ever recorded.
Dodging Bullets
A case in point, this site’s narrow miss on having a huge gain (LABD-25-06, short biotech) being completely obliterated in last week’s largest short squeeze, ever.
It’s (almost) a ‘no-brainer’, this type of market behavior is not bullish (not advice, not a recommendation).
Then, The Propaganda
If it’s not dodging bullets, it’s sifting through the propaganda, half-truths, and outright lies.
The latest of these, (could be) ‘China dumping dollars’ and other ‘collapse’ narratives.
There’s volatility for sure. That’s what bear markets are about. However, this link might help mitigate the hysteria around the ‘It’s all blowing up’ narrative (not advice, not a recommendation).
In the above link, how it really works, time stamp: 17:58
So, here we are. What’s next?
Gold & Silver, Update
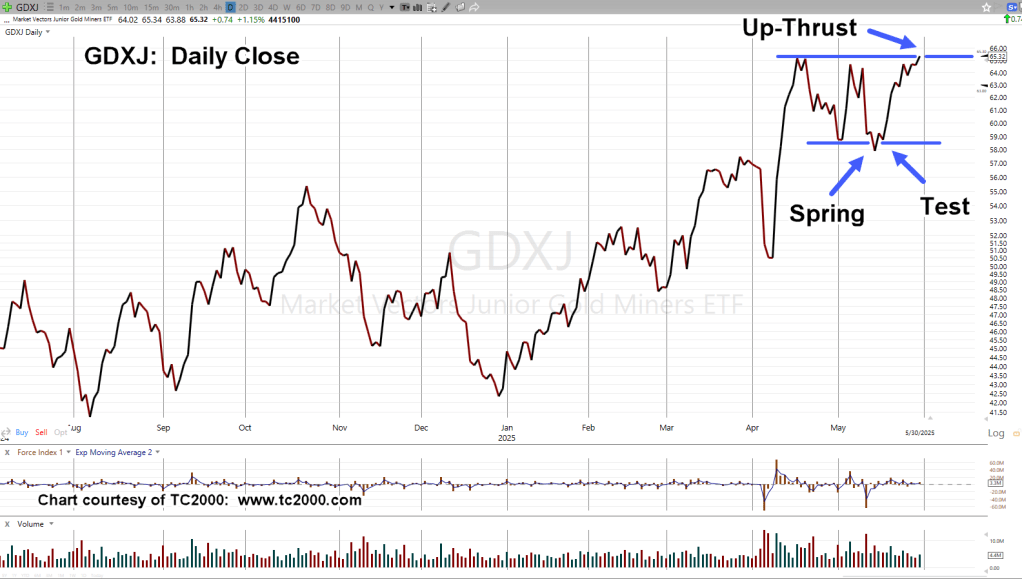
Even though both gold (GLD), and silver (SLV), are trading lower as of this post (12:52 p.m., EST), the Junior Miners GDXJ, posted a new daily high, thus, short JDST-25-09, was exited (not advice, not a recommendation).
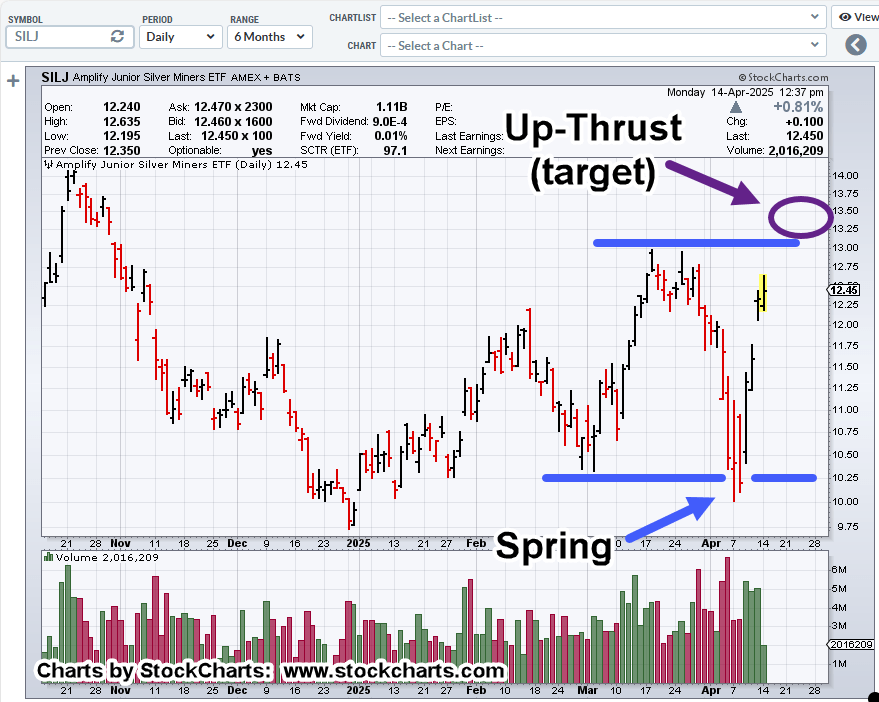
Today’s activity does point to a new potential (developing) set-up, this time, silver miners SILJ.
Silver Miners SILJ, Daily
The set-up (spring-to-up-thrust) may develop from here, or it could diffuse into chaos.
It remains a possibility, until price action itself says, ‘no’.
Note: Posts on this site are for education purposes only. They provide one firm’s insight on the markets. Not investment advice. See additional disclaimer here.
Note: Posts on this site are for education purposes only. They provide one firm’s insight on the markets. Not investment advice. See additional disclaimer here.
Yesterday’s mid-session update said Carvana’s posting a repeating pattern.
That pattern is what’s called a Wyckoff ‘spring-to-up-thrust’.
Even before, yesterday, this update said we’re expecting some kind of bounce.
Well, we got it; then, price action went on to post a potential reversal (not advice, not a recommendation).
Today’s session may or may not contain a ‘test’ of that (reversal) action.
Let’s go to the chart.
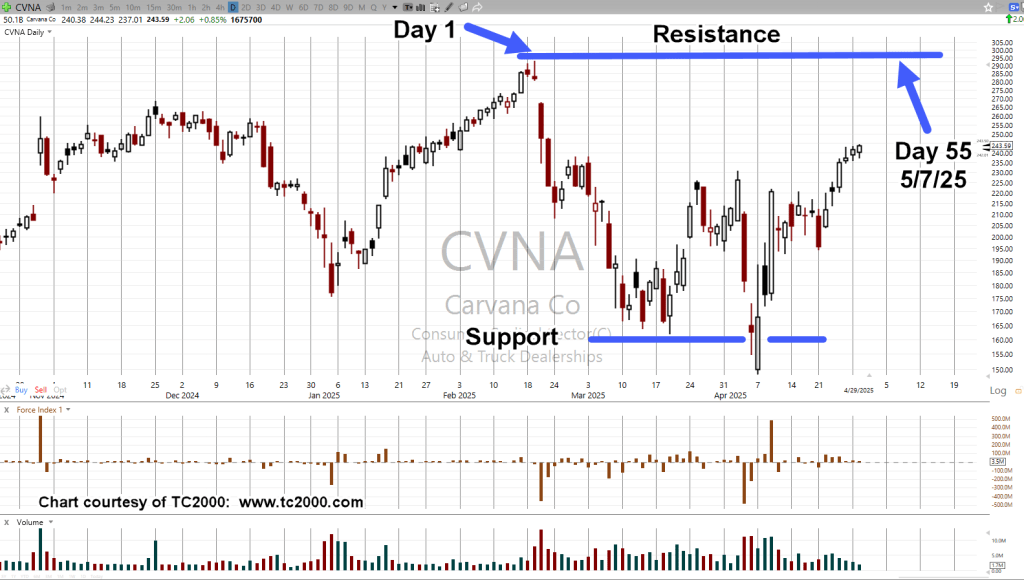
Carvana CVNA, Daily
There’s a lot going on.
As the chart notes, when taking the retrace measurement from the after-hours high of 310, posted during the earnings release, yesterday’s action topped out right at the Fibonacci 23.6%, level.
We’re about twenty-minutes before the regular session; CVNA, is trading lower by 3.6-pts.
Note: Posts on this site are for education purposes only. They provide one firm’s insight on the markets. Not investment advice. See additional disclaimer here.