Those on the bear side of the AI insanity, know in their gut, this sector’s going to implode in spectacular fashion (not advice, not a recommendation).
Note: Posts on this site are for education purposes only. They provide one firm’s insight on the markets. Not investment advice. See additional disclaimer here.
Upward price action in the SOXX, held overnight and then some.
A discretionary exit was made in the pre-market session at SOXS 8.42 (not advice, not a recommendation).
Switching gears, we’re leaving the SOXX and AI alone for now.
As mentioned in a prior post, the life insurance sector appears to be correlated with biotech. It’s a fact the life insurance companies are talking a hit from ‘excess’ payouts.
We all know or should know just what’s causing the ‘excess’, so we’ll leave it there.
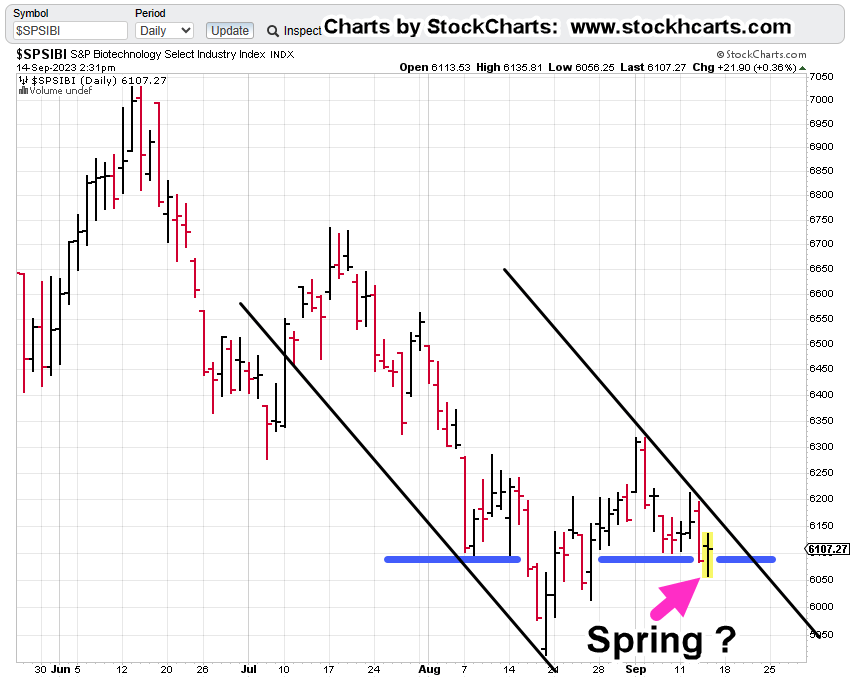
That leads to the biotech sector (SPBIO) and what appears to be a downside reversal.
Biotech SPBIO ($SPSIBI), Weekly
When looking at the chart for the past three years, one thing is certain; this is not a bull market.
The blue arrow shows the location of a short position opened (via LABD @ 14.70) in today’s pre-market session (not advice, not a recommendation).
A Hard Stop for the position is LABD 13.31.
Since that’s a fair distance from the entry, a discretionary exit may be made by the trader at any time based on the behavior of price action going forward.
Note: Posts on this site are for education purposes only. They provide one firm’s insight on the markets. Not investment advice. See additional disclaimer here.
Taiwan Semi (TSM) releases lackluster results, revenue slowdown and new building construction delays.
TSM says the delays stem from the inability to find qualified workers.
Edward Dowd provides insight on the overall reduction of employees, in this interview (Time stamp 5:10).
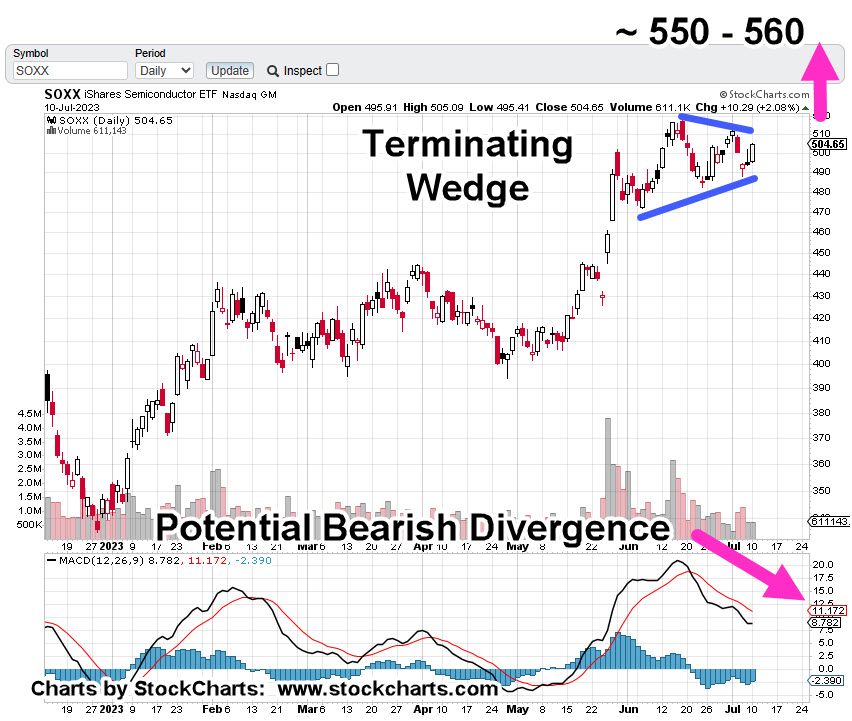
Bull Trap Shut, Train Leaving Station
If there ever was a ‘gotcha’ moment, this is it.
Even while the mainstream continues to tout the hype, here, here and here, the market has reversed (not advice, not a recommendation).
The daily chart of SOXX, has the MACD bearish divergence confirmed. Price action is now (as of 3:05 p.m., EST) well below the breakout (blue line) resistance area.
Semiconductor SOXX, Daily
This site does not give advice, but it can be inferred by reading the reports what actions are being executed (not advice, not a recommendation).
With that said, short positions in the SOXX, via leveraged inverse SOXS, were entered early during yesterday’s session at SOXS 8.54 and SOXS 8.69.
As a side note, within minutes after today’s market open, the gain in the SOXS, fully erased the -7.9% loss via LABD, noted in yesterday’s update.
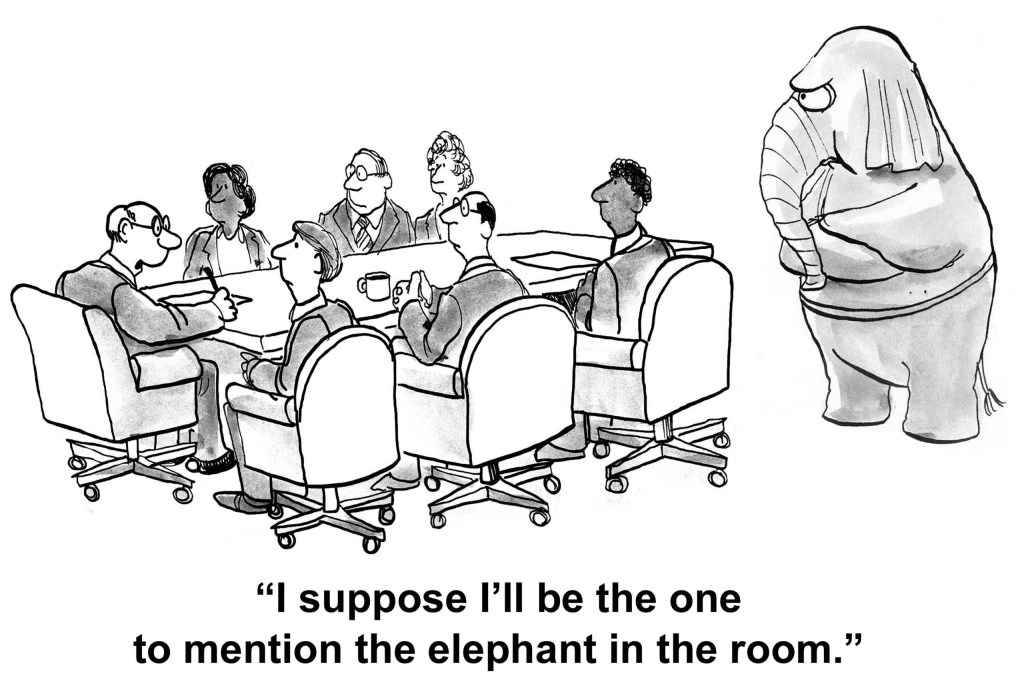
The Biotech ‘Bid’
For whatever reason, probably to be revealed months or years from now, biotech, the instigator of the ‘elephant’ is not selling off into a market collapse as expected.
Instead, the effects are being played out in low-margin industries like airlines and semiconductors.
Note: Posts on this site are for education purposes only. They provide one firm’s insight on the markets. Not investment advice. See additional disclaimer here.
If Artificial Intelligence, really is the last of the bubble(s), isn’t it appropriate we culminate in a market top of the ages, with the desire (and delusion) that we can be like God.
Let’s ask ‘AI’ how to get rid of spike protein … see what it says.
We’re around mid-day; the SOXX, is raging a bull/bear battle inside the range of yesterday’s session.
Tuesday’s session was not able to post a new high or low. With that said, the Fibonacci count from the last update remains intact.
Semiconductor SOXX, Daily
The chart shows upside pressure (volume) is dissipating.
As of this post, the MACD (not shown) is flat, waiting to tick lower; not yet confirming the bearish divergence.
A penetration of the prior session low, SOXX 524.11, would give a classical analysis sell signal (not advice, not a recommendation).
Note: Posts on this site are for education purposes only. They provide one firm’s insight on the markets. Not investment advice. See additional disclaimer here.
Note: Posts on this site are for education purposes only. They provide one firm’s insight on the markets. Not investment advice. See additional disclaimer here.
We’re going to start first, with this link, presenting the on-going fundamentals of the sector.
For those of us literally pulling their hair out, wondering if the dam is ever going to break, we have this link.
‘We’ve just poisoned 5-Billion people …’
Note: The dam break is the ‘event horizon’ where everyone collectively wakes-up. Once that happens, the ‘conspiracy’ has been proven as undeniable fact.
Biotech SPBIO, may or may not have an absolute direct connection with the aforementioned links but it’s the ‘baby with the bathwater’ response that’s expected.
Adding to that, big players in this sector have no P/E
The top-ten weightings keep changing, but the last time it was checked, none in the top-ten, had a P/E.
Since we’re working the short side, it’s the leveraged inverse fund LABD that’s of interest.
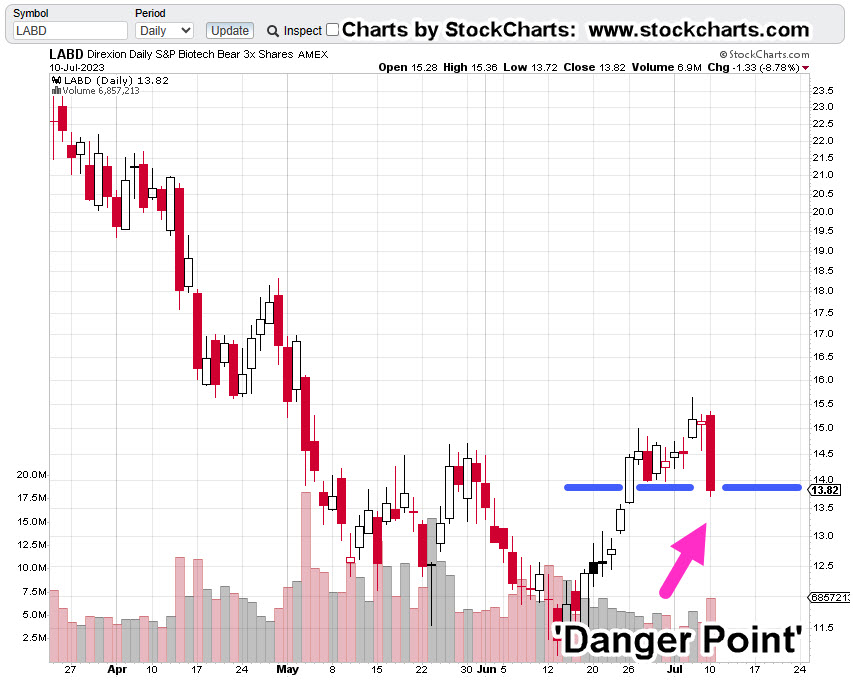
Biotech Leveraged Inverse LABD, Daily
Note the near perfect Fibonacci time correlation.
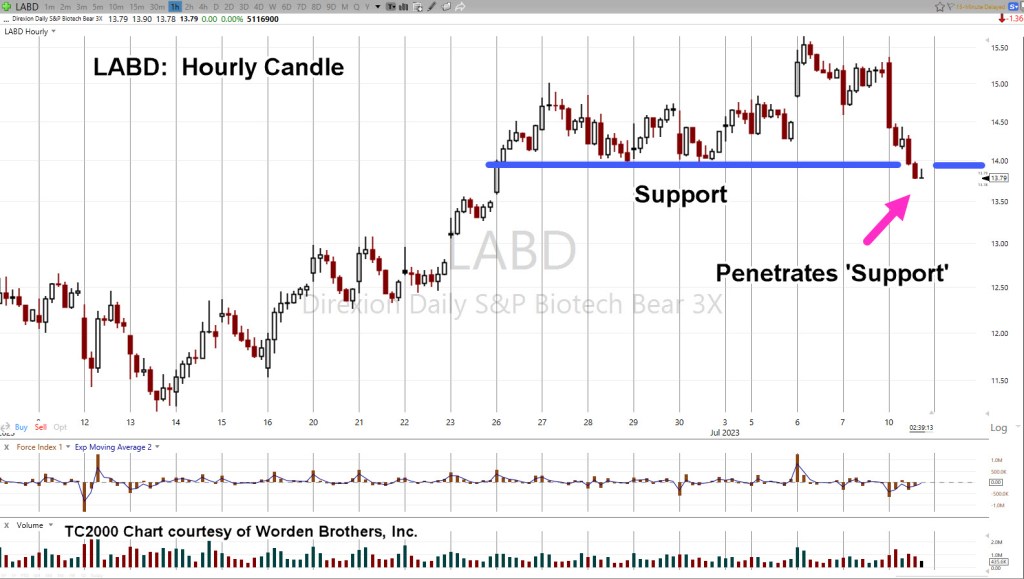
As of today’s close, price action on the LABD has got itself into a Wyckoff ‘spring position’ having decisively penetrated support (blue line), shown below.
That spring set-up has been accomplished on weak down-thrust when compared to the prior move lower.
We have a high probability of upside reversal, down for SPBIO (not advice, not a recommendation).
Positioning
Stated in the prior update, we’re short this sector (long LABD) and now have Hard Stop @ LABD 13.27 (not advice, not a recommendation).
Update: 7/13/23, 2:51 p.m. EST
LABD price action pushed to 13.26, just 0.01, below the above listed stop and is now moving higher.
Trade has been maintained (not advice, not a recommendation)
Note: Posts on this site are for education purposes only. They provide one firm’s insight on the markets. Not investment advice. See additional disclaimer here.
Note: Posts on this site are for education purposes only. They provide one firm’s insight on the markets. Not investment advice. See additional disclaimer here.
Note: Posts on this site are for education purposes only. They provide one firm’s insight on the markets. Not investment advice. See additional disclaimer here.
The prior analysis of biotech SPBIO, had expectations for price action to rise into the 6,400 area: the location of the 200-Day Moving Average.
It did that, and more …
Back in late April, SPBIO, was in a Fibonacci time sequence. Shown below, that time structure may still be intact.
But First … The List
Note: This is not “The List“, as has been compiled (still on-going), covering the horrors of this sector but rather a list of reasons why SPBIO, is likely to head lower from here.
Here it is, not in any particular order:
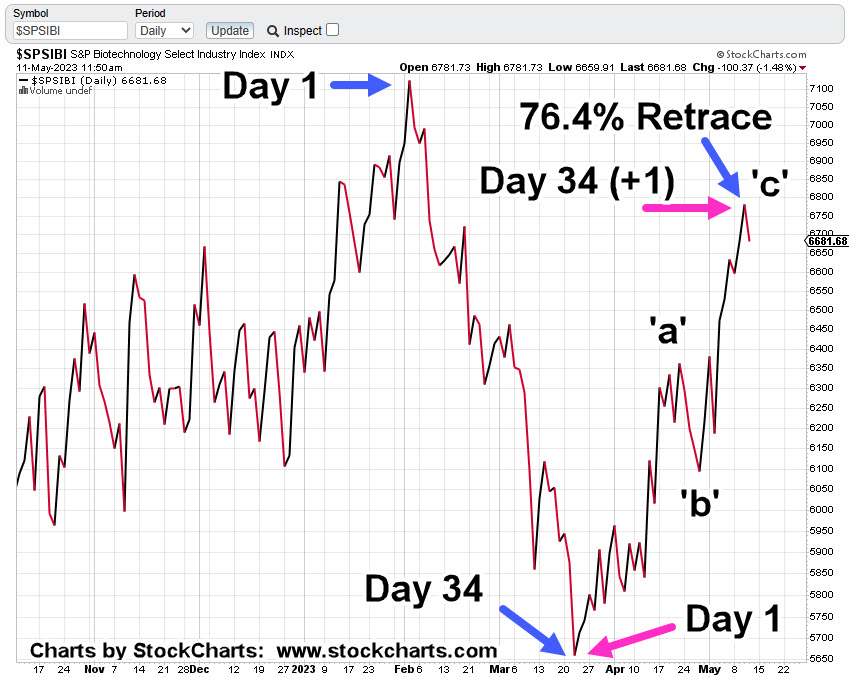
Price action has reached a Fibonacci 76.4%, level
From the March 24th low, price action has retraced upward in an ‘a-b-c’ corrective move, with wave ‘a’ distance equal to wave ‘c’. Note: Equal distance ‘a’ and ‘c’, on a print basis.
At the last session, as the action pushed to a new daily high, there was ‘evidence of a struggle’ during the session to either reverse lower or move higher. Action was undecided and closed slightly below the open.
Looking at the first chart below, the daily close for the past three-years has the trend decidedly down; this sector is the weakest of all the major indices.
On the chart below, there’s a series of lower highs, lower lows that have oscillated into a massive bearish wedge.
Yesterday (Wednesday) was a Fibonacci 34 days (-1), from the print lows set on March 24th. That day was also a Fibonacci 34 days (+1), from the closing low set on March 22nd. We’re still posting a Fibonacci Time correlation.
From the highs set on February 2nd, to the lows on March 24th and then to the highs set yesterday May 10th, is symmetrical; separated by a Fibonacci 8-weeks lower and then Fibonacci 8-weeks higher.
Fundamentally, this sector is a disaster. None of the top ten equities have a P/E. All are losing money.
No P/E and operating at a loss; interest rates rising, credit standards being tightened. How are these outfits going to secure more Venture Capital (or any additional funding via stock/debt) in that environment; implosion is dead-ahead (not advice, not a recommendation).
Bank failures continue … at some point (as with the rest of us) one of these banks may be the line of credit for company payroll. Not all banks went bust in The Great Depression but just enough to halt payroll for some key industries. That event helped topple the economy.
The list goes on but that’s enough to make the point.
Now, on to the charts.
Biotech SPBIO, Daily Close
Moving closer in, to show the Fibonacci retrace, the Fibonacci time and the ‘a-b-c’ structure.
As of this post (12:25 p.m., EST) price action continues its downside reversal.
Because the retrace level (76.4%) is the highest noted by Fibonacci, we can expect some amount of upward testing if there’s going to be a sustained downside.
Anything can happen. However, with the above list compiled for both technical and fundamental conditions, probabilities point lower (not advice, not a recommendation).
Note: Posts on this site are for education purposes only. They provide one firm’s insight on the markets. Not investment advice. See additional disclaimer here.
Note: Posts on this site are for education purposes only. They provide one firm’s insight on the markets. Not investment advice. See additional disclaimer here.