Bond Fireworks, Dead Ahead

With the highest level of short positions in bond history, it’s reversing.

Short sellers have been hypnotized after six months of non-stop downward action … sometimes the reversal begins quietly.

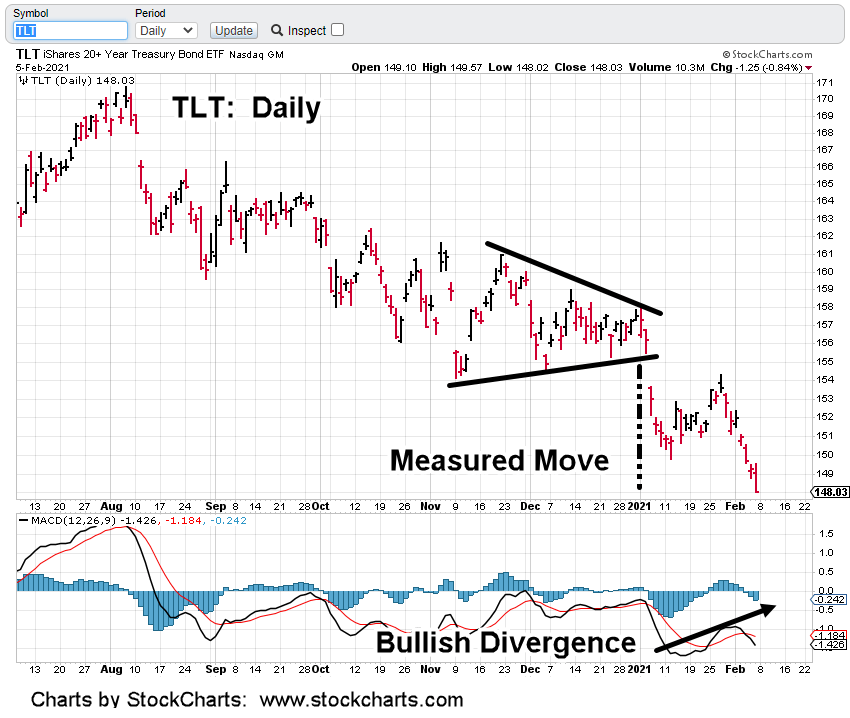
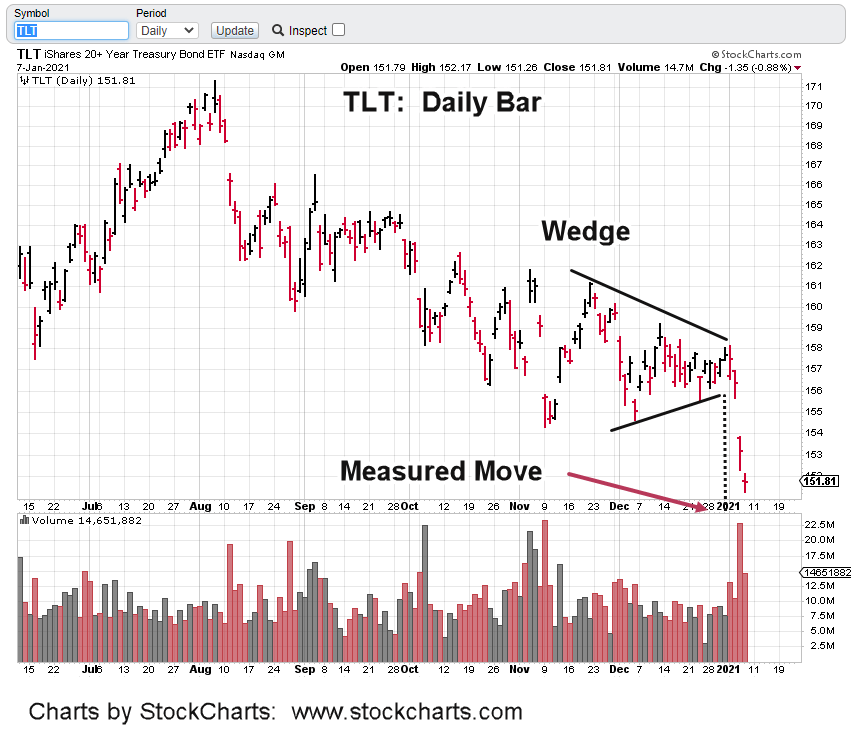
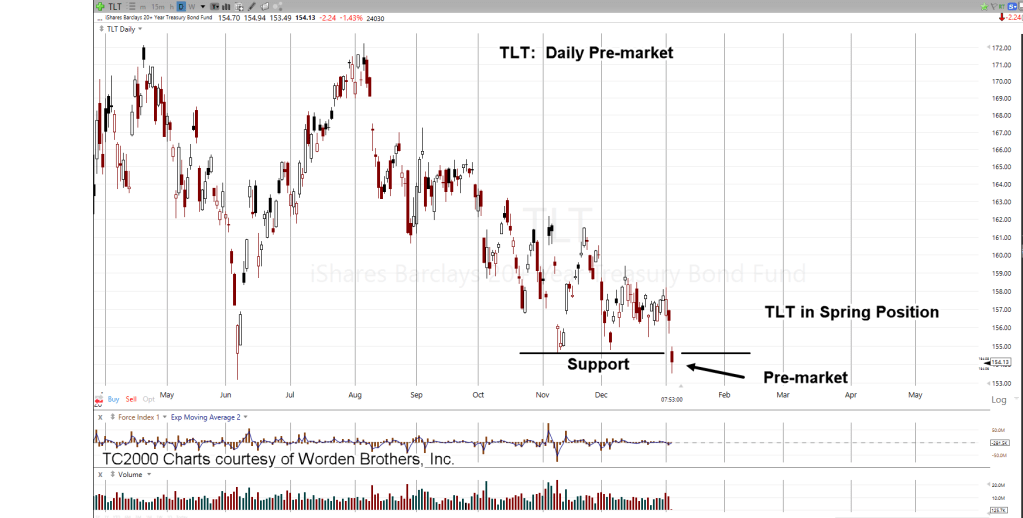
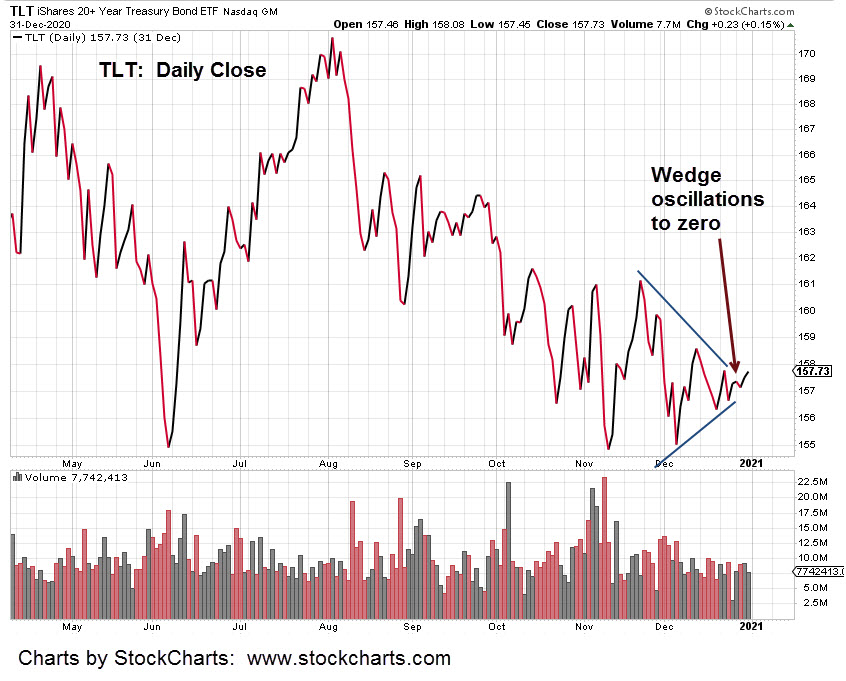
The clues are there. Bullish MACD in both histogram and the lines. The price action trap-gap.

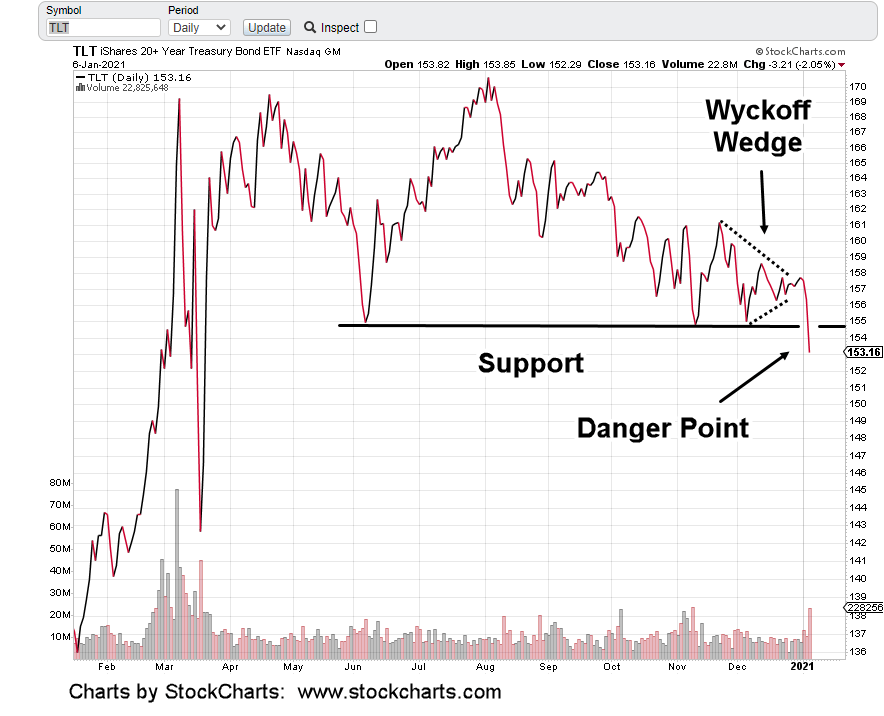
The purple oval has been expanded to the left showing the ‘trap-gap’. This type of action is common during a surprise reversal.

The problem is, it’s all connected. Bonds rising indicate the economy is weak. Actually, the economy is dead (by design).

Just take a look at one of Jeremia Babe’s walk-around updates.

Businesses and malls are ‘decimated’ in his words. Here’s the latest from him … just out.

The TLT and HYG (junk bond) both reached their extremes on the same day but in opposite directions.

TLT reached its low and HYG reached its high.

Now, both those markets have reversed. The latest CPI numbers were a surprise. It highlighted that hyperinflation is not there.

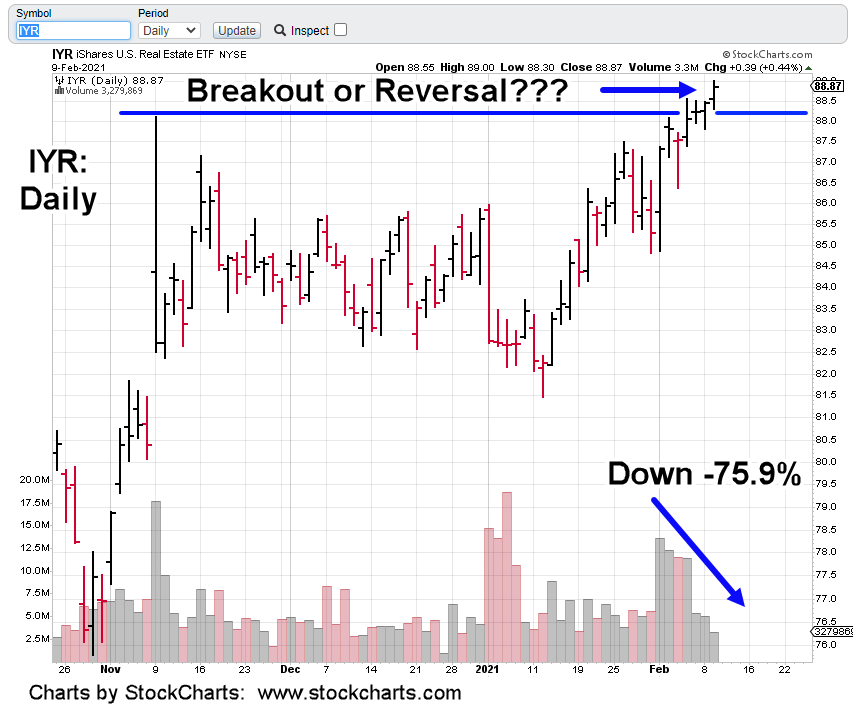
That article also pointed out, rent inflation (i.e. commercial real estate) is decreasing.

One last thing. The broker used by the firm has posted a message each day upon logging onto the trade platform. That message is to the effect:

‘As a result of increased market activity, we’re experiencing especially high call volume and hold times’

This message is being posted when the market is going up!

Are any of the major brokers going to effectively handle the herd of retail calling in a panic, trying get out of a downside trading halt?

Stay Tuned

Charts by StockCharts

Note:  Posts on this site are for education purposes only.  They provide one firm’s insight on the markets.  Not investment advice.  See additional disclaimer here.

Into Thin Air …

Yesterday’s action in IYR, looks like a breakout higher.

That is, until you look at volume.

Price action levitates higher while everyone leaves the party.

From the start of the last thrust higher on February 1st, volume has declined over 75%.

There are two possibilities:

  1. Buyers and Sellers are backing away; letting prices drift.
  2. There’s no bullish commitment at these levels; reversal imminent.

Two quotes that accurately sum up the overall market situation; from Johnny Bravo and Steven Van Metre respectively:

‘One thing or the other, something’s going to break’

‘This is pretty dangerous stuff going on here’.

Before we wrap up, we’ll add just one more thing.

Junk yields have sunk to record lows.

Why buy TLT at ‘relatively’ safe 1.55%, when you can have junk yield at 3.95%, that’s going to blow-up (launching TLT into the stratosphere) at any time.

Stay Tuned

Charts by StockCharts

Note:  Posts on this site are for education purposes only.  They provide one firm’s insight on the markets.  Not investment advice.  See additional disclaimer here.

Bonds: Measured Move, Met

From the wedge breakout to the downside, Friday’s action in TLT has met the measured move.

Price action finished at the low of the day (+0.01) and is posting a bullish MACD divergence.

On the other end of the spectrum, the S&P 500 finished at all time highs.

Intuitively, we can see how this is setting up.

Each market is at an extreme. That includes real estate, IYR at its own 76.4%, retrace … although severely lagging the S&P.

Unfortunately at such junctures, we can expect some type of ‘incident’ to set things off in the opposite direction.

It may not happen but if it does, the markets define the news; not the other way around.

Stay Tuned

Charts by StockCharts

Note:  Posts on this site are for education purposes only.  They provide one firm’s insight on the markets.  Not investment advice.  See additional disclaimer here.

Ruh, Roh: Bond Reversal

Now, it gets interesting.

Bonds sold short the most in history.

Then, today’s action is reversal with moderate volume.

On the dollar side, at first glance it looks like a terrible day.

Action was down 0.53%.

The reality is, UUP came down to test an up-trend line formed as part of its own reversal last Thursday.

Both dollar and bonds are in an upside reversal; the dollar looks slightly ahead by a few days.

Real estate (IYR) has rallied (sort-of) which may only be temporary; likely on the (false) belief lower bond yields are good for higher yielding sectors.

Not true when we still have (as Van Metre puts it), the ‘insolvency event’ yet to come; everyone going bankrupt all at the same time.

Anything can happen and the above analysis could fall apart tomorrow.

On the probability side, looks like we’ve seen the extremes in the major sectors; now ready for reversal pivots.

Note:  Posts on this site are for education purposes only.  They provide one firm’s insight on the markets.  Not investment advice.  See additional disclaimer here.

Gold Down. Why?

We have the usual suspects rolled out; providing expert analysis on why gold went down.

The answer is quite simple. It tested a trend break, then reversed.

If we look at the (close) chart of GLD, it broke an uptrend during the week of November 20th, last year; went lower and then back to test.

That test was rejected dramatically with Gold (GLD), heading significantly lower; getting whacked down over 5%, in just two days.

This is not bull market behavior.

Steven Van Metre’s assessment (at this juncture) that we’re in a deflation event is being shown correct. The lagging factor in the scenario is the overall market … still near all-time highs.

It’s true bonds broke lower (rates up) this week but that’s another event answered by technicals; the wedge formation, discussed here.

Both bonds and the dollar have set the stage for a swift reversal.

Just how that’ll affect an extended, obscenely overvalued, stretched, call options wild market with everybody all-in, is not known.

Getting back to Van Metre; he’s reported, during this past week, small traders/speculators added to short (bond) futures positions.

If there’s a signal bonds are stretched, ready to reverse, it’s the little-guy just now getting in (going short) …. right at the bottom; as usual.

Charts by StockCharts

Note:  Posts on this site are for education purposes only.  They provide one firm’s insight on the markets.  Not investment advice.  See additional disclaimer here.

Bonds Pulled Tight

Overnight and early pre-market, bonds have completed a measured move.

Using the 10-yr note (futures) as the proxy for overnight, we’ve updated the TLT chart to show the target (bottom of dashed line).

The low was hit overnight; now bonds are edging back higher.

It’s like a drawstring pulled tight.

As Livermore said years ago (in Reminiscences), the manipulators will push a stock to the sell levels they want but not too much.

Too much of a push will bring in more selling and they’ll lose control.

Bonds pulled tight but not too tight.

The long bond was already sold short the most in history. It’s possible speculators are even more short now.

Dollar also higher in overnight and pre-market; that could be shutting the trap for bears in both markets.

Charts by StockCharts

Note:  Posts on this site are for education purposes only.  They provide one firm’s insight on the markets.  Not investment advice.  See additional disclaimer here.

Bonds Down

Bonds closed decisively below support at the last session.

This morning in the pre-market, they are trading near the bottom of yesterday’s range.

The TLT chart has the details. We have the ‘Wyckoff Wedge’ (as we’re calling it) as discussed in a prior update.

We’re at the danger point and in spring position.

That means, if bonds push back above the resistance and test, it’s a strong indication of a huge rally to come.

Think of the wedge as a clock pendulum oscillating down to zero.

To get the clock started again, the pendulum must be pulled to one side and then let go.

Separately, as a result of this price action, Steven Van Metre, is starting to lose some fans. Nothing against him.

It’s just that a vast majority of the investing public, has very little idea of how the markets actually work.

Wyckoff called it the ‘Composite Operator’.

Today’s interpretation could be called the ‘Central Mind’. There is manipulation behind everything … always has been.

A push below support, is doing what the Central Mind wants.

That is, the bond bulls to give up, lose their following, have accounts pulled (withdrawn) and for them to start questioning their own analysis.

Charts by StockCharts

Note:  Posts on this site are for education purposes only.  They provide one firm’s insight on the markets.  Not investment advice.  See additional disclaimer here.

Before The Open

It’s busy in the pre-market and the big story is bonds.

The last update, using Wyckoff as the example, said bonds would break to the upside from the wedge formation.

Sometimes before such a break, there’ll be a momentary push in the opposite direction.  Then the real (reversal) move starts. That may be what’s happening now.

Looking at TLT, pre-market is trading below well-established support.  If that’s where TLT opens, it may be the last gasp for the bears. 

Note:  Posts on this site are for education purposes only.  They provide one firm’s insight on the markets.  Not investment advice.  See additional disclaimer here.

Bond Bears Exhausted

About a year after Teddy Roosevelt left office, Wyckoff published his seminal work; Studies in Tape Reading. That year, was 1910.

Wyckoff was the one that defined support, resistance, accumulation and distribution.

He was the one that discovered markets have a power of their own; having nothing to do with any fundamentals.

Wyckoff found that if you can decipher price action, you can determine the most probable direction.

A first edition Wyckoff ‘Tape Reading’ text … if you can find it, goes for about $3,500. 

Even lesser known books of Wyckoff such as this one, go for hefty sums.

In his ‘Tape Reading’ text, on page 102, he shows a diagram that represents price action exhaustion.

His discussion (repeated below) is concerning the bull side. 

For today’s chart of TLT, we’ll mentally swap every ‘bull’ notation from Wyckoff with ‘bear’ and conversely, every ‘top’ notation with ‘bottom’, every ‘buy’ notation with ‘sell’ and so on.

 “ … and you see what the chart of  a stock or the market looks like when it reaches a point of dullness.

These dull periods often occur after a season of delirious activity on the bull side.  People make money, pyramid on their profits and glut themselves with stocks at the top.  As everyone is loaded up, there is comparatively no one left to buy and the break which inevitability follows would happen if there were no bears, no bad news or anything else to force a decline.”

The ‘dull’ period he is discussing is shown below in TLT.  It has repeated the diagram on his page 102, in near identical fashion.

We have supplementary evidence from Steven Van Metre during this report, the bond bears have started to back off their historic short positions.

They are trapped and exhausted; all their selling has not collapsed bonds as anticipated.

So, let’s see what happens next.  According to a text written 110-years ago, we are expecting a rally in bonds .. a massive rally.

Quotes used with permission

Charts by StockCharts

Note:  Posts on this site are for education purposes only.  They provide one firm’s insight on the markets.  Not investment advice.  See additional disclaimer here.

AT&T Outage Map

The last update, posted just hours ago said this:

“The “Christmas Bomb” cut communication lines … which by the way is the very first objective during any battle; cut the enemy’s communications.

Matter of fact; that could be the ‘reason’. A test to see how badly communications were disrupted; how quickly they recovered.

At time stamp 2:00 in this link, Salty Cracker shows the AT&T outage map; nearly half of the U.S. has been affected.

Next week, the markets could rally on such news. Anything can happen.

However, lack of communication means lack of commerce … for an unknown amount of time.

Downside action would seem more probable.

There’s still one more day before the open on Monday … seems like a long way away.

It’s possible by that time, participants will want the safety of bonds.

Bonds that are already sold-short, the most in history.

Stay Tuned

Note:  Posts on this site are for education purposes only.  They provide one firm’s insight on the markets.  Not investment advice.  See additional disclaimer here.