We have the usual suspects rolled out; providing expert analysis on why gold went down.
The answer is quite simple. It tested a trend break, then reversed.

If we look at the (close) chart of GLD, it broke an uptrend during the week of November 20th, last year; went lower and then back to test.
That test was rejected dramatically with Gold (GLD), heading significantly lower; getting whacked down over 5%, in just two days.
This is not bull market behavior.
Steven Van Metre’s assessment (at this juncture) that we’re in a deflation event is being shown correct. The lagging factor in the scenario is the overall market … still near all-time highs.
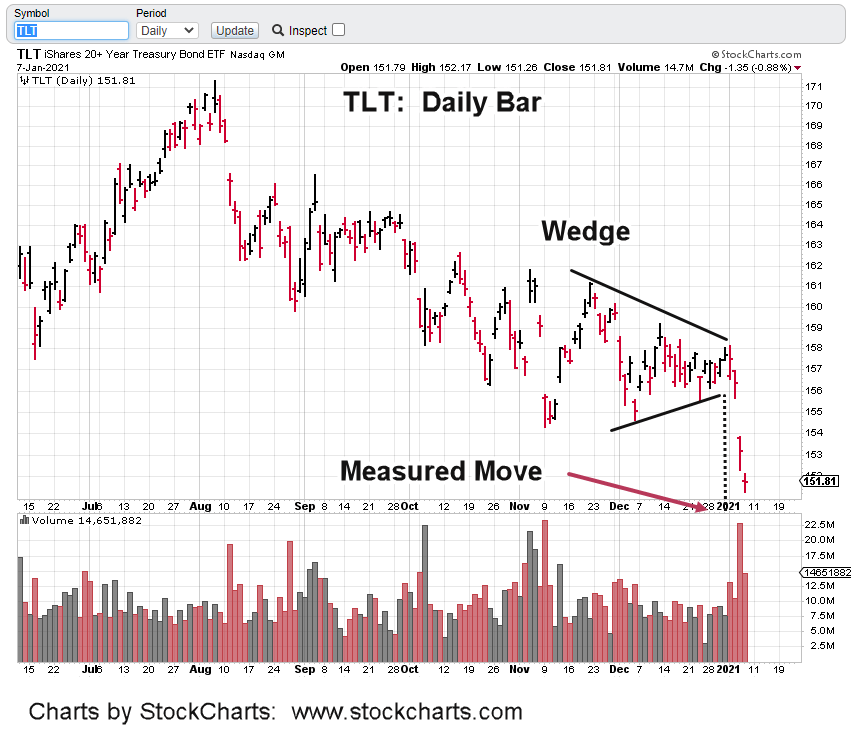
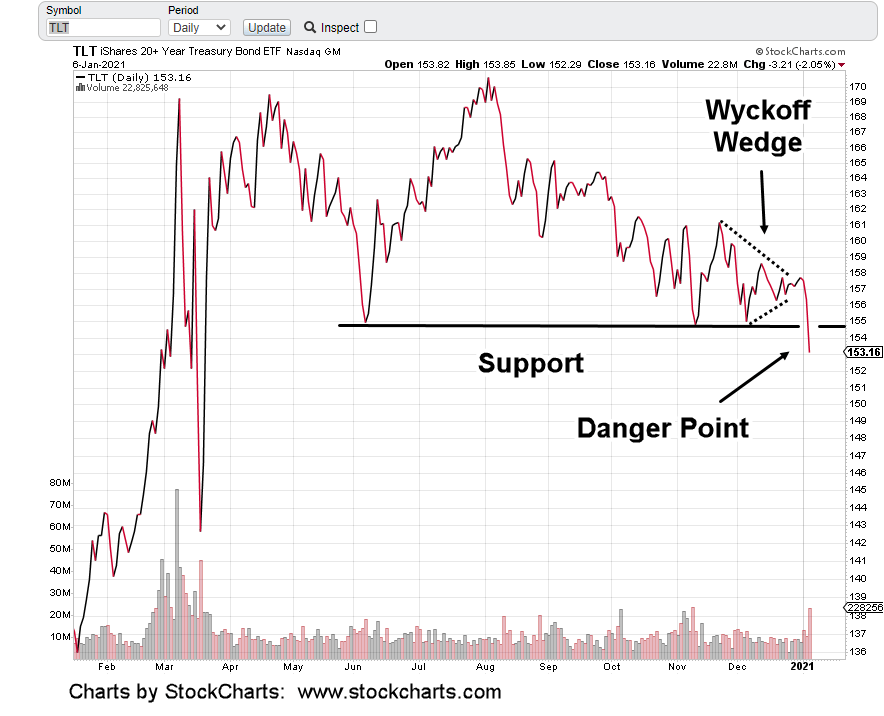
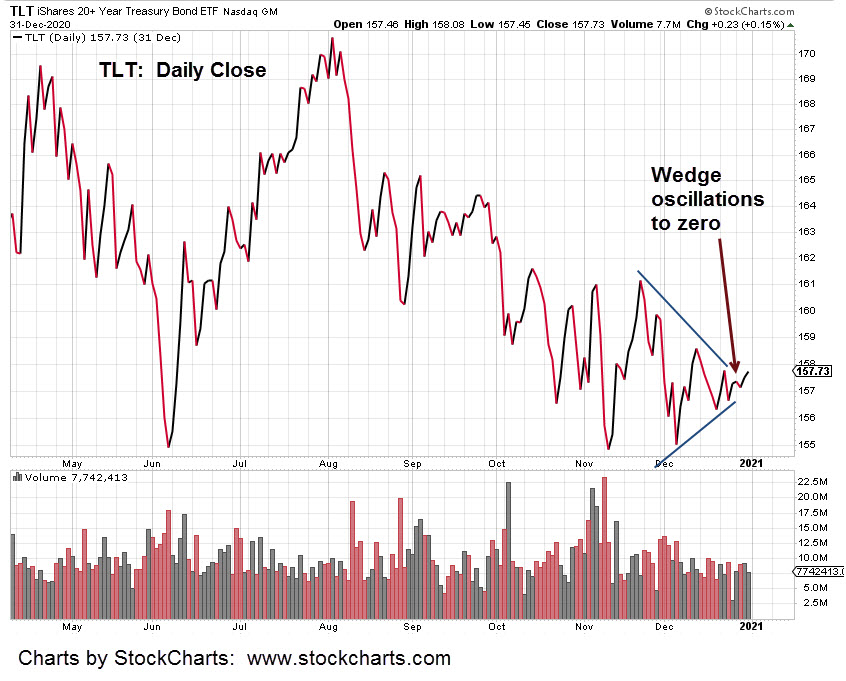
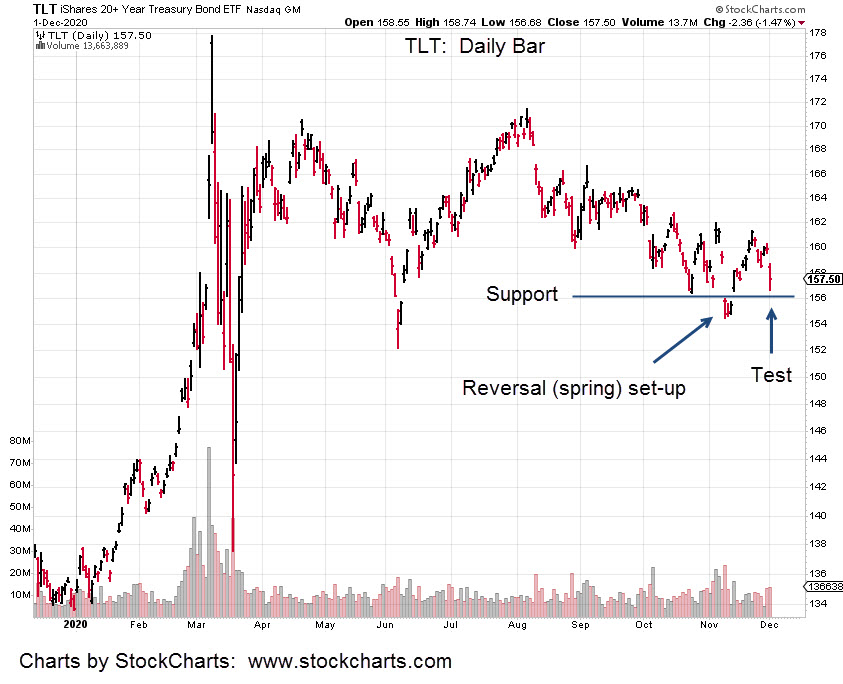
It’s true bonds broke lower (rates up) this week but that’s another event answered by technicals; the wedge formation, discussed here.
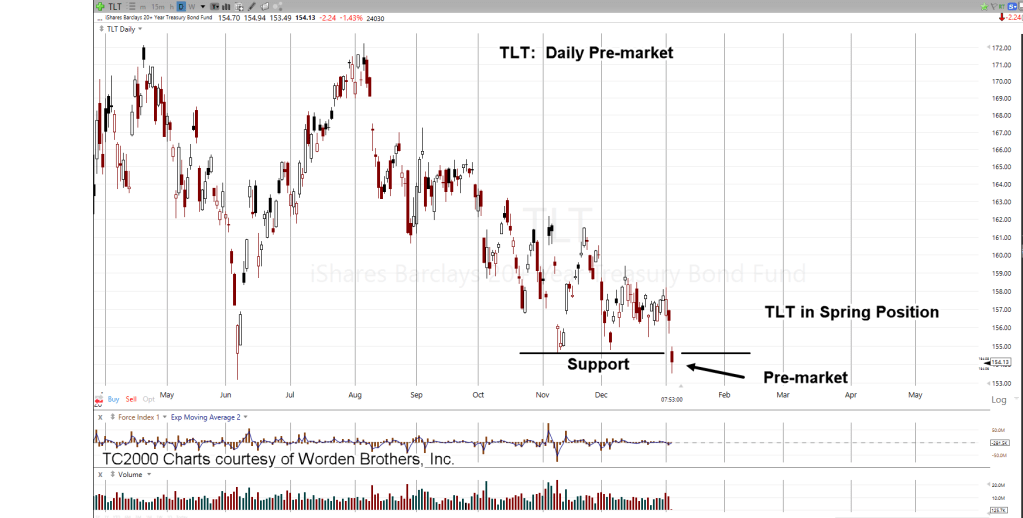
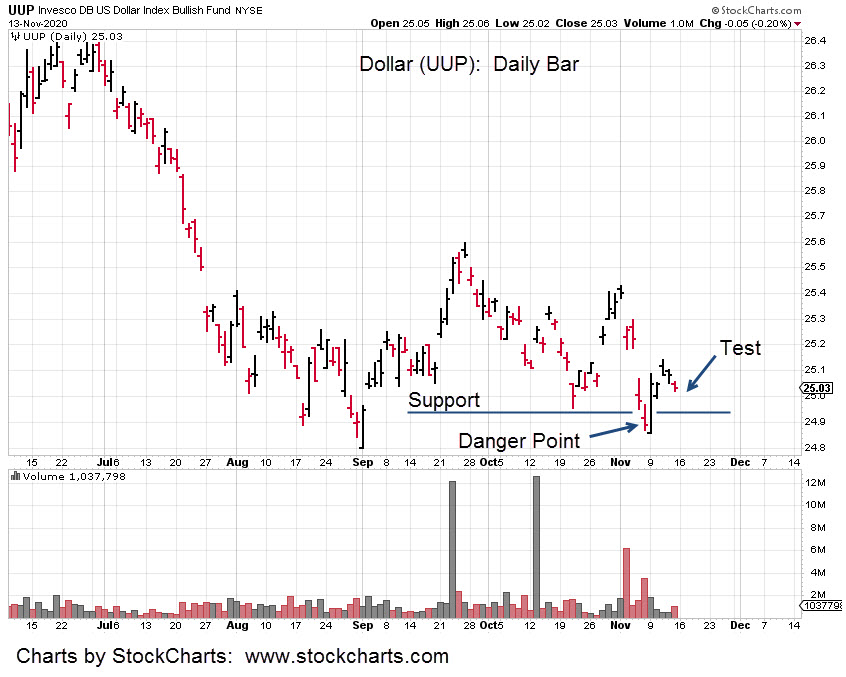
Both bonds and the dollar have set the stage for a swift reversal.
Just how that’ll affect an extended, obscenely overvalued, stretched, call options wild market with everybody all-in, is not known.
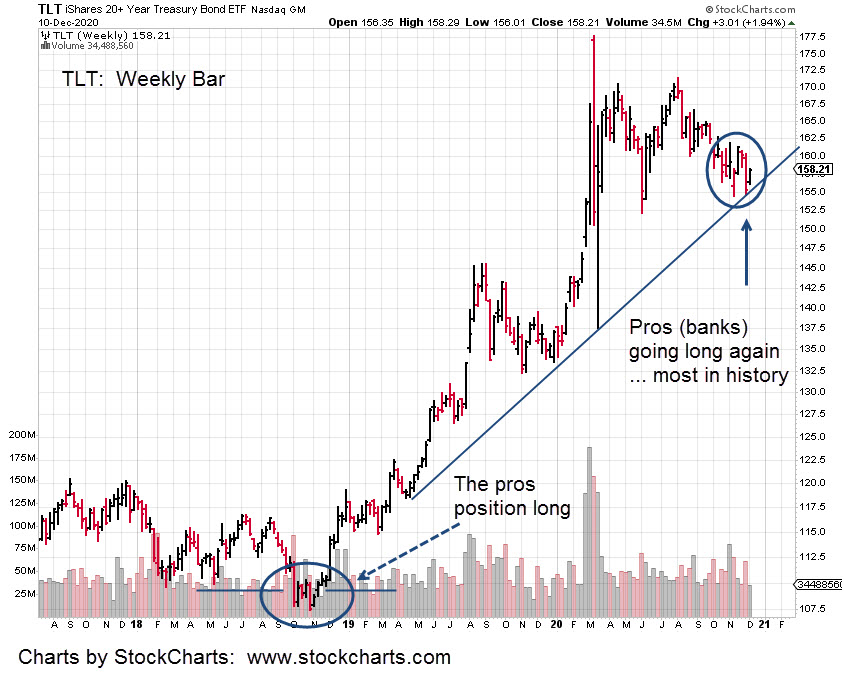
Getting back to Van Metre; he’s reported, during this past week, small traders/speculators added to short (bond) futures positions.
If there’s a signal bonds are stretched, ready to reverse, it’s the little-guy just now getting in (going short) …. right at the bottom; as usual.
Charts by StockCharts