The dollar has been inversely correlated since March of last year.
A reversal was identified in this report which thus far, has proved correct.
Bonds are also showing higher in the pre-market, having met a measured move (wedge) target last week.
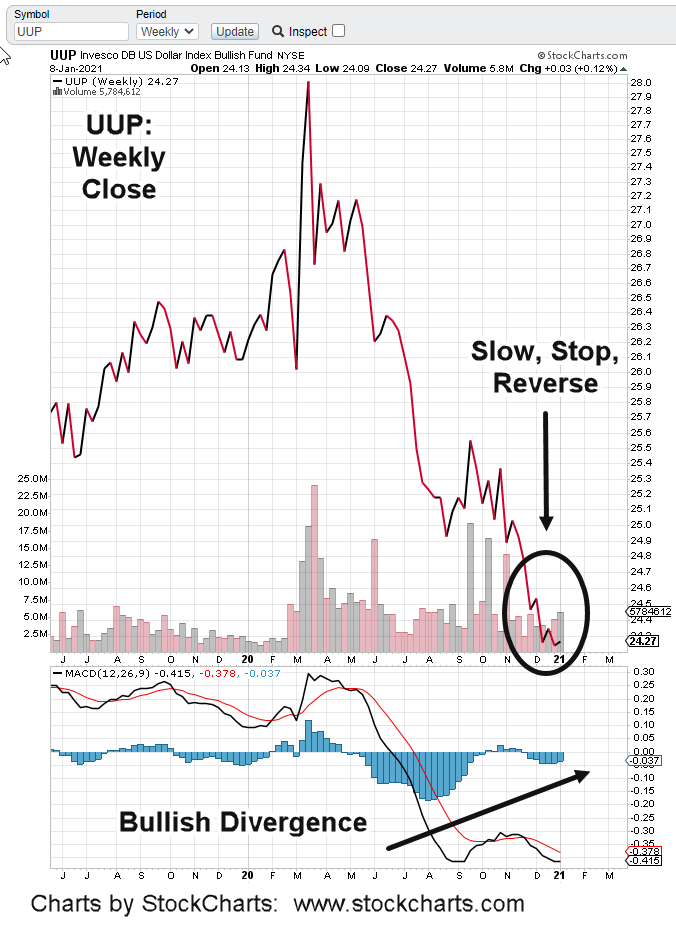
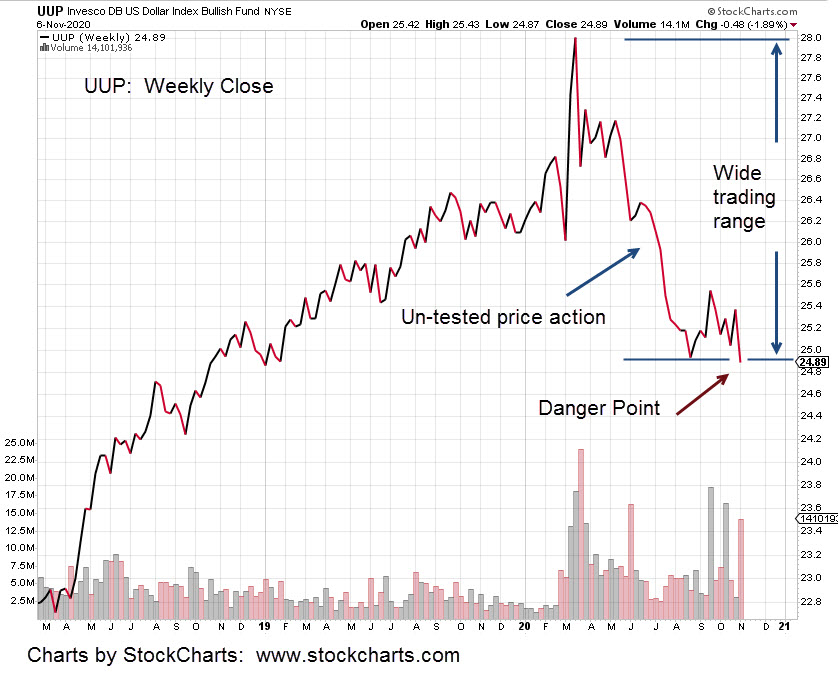
The UUP, weekly close has price action slowing its decline, stopping and then reversing. That’s where we are now.
Weekly MACD ticked up (slightly) last week and higher open this morning, would confirm the divergence.
Market sentiment readings as reported by J. Bravo (time stamp 1:00) are literally, off the charts.
On top of that, internet scuttlebutt over the weekend shows at this juncture, absolutely anything can happen.
Having a market stance (or position) that includes possibility of power outages, banks going off-line, internet disruptions and general overall chaos, would seem to be reasonable.
In line with that, entries were made in DRV last week as shown (not advice, not a recommendation):
Pre-market activity for IYR, points to a lower open, DRV higher.
Note: Posts on this site are for education purposes only. They provide one firm’s insight on the markets. Not investment advice. See additional disclaimer here.
We have the usual suspects rolled out; providing expert analysis on why gold went down.
The answer is quite simple. It tested a trend break, then reversed.
If we look at the (close) chart of GLD, it broke an uptrend during the week of November 20th, last year; went lower and then back to test.
That test was rejected dramatically with Gold (GLD), heading significantly lower; getting whacked down over 5%, in just two days.
This is not bull market behavior.
Steven Van Metre’s assessment (at this juncture) that we’re in a deflation event is being shown correct. The lagging factor in the scenario is the overall market … still near all-time highs.
It’s true bonds broke lower (rates up) this week but that’s another event answered by technicals; the wedge formation, discussed here.
Both bonds and the dollar have set the stage for a swift reversal.
Just how that’ll affect an extended, obscenely overvalued, stretched, call options wild market with everybody all-in, is not known.
Getting back to Van Metre; he’s reported, during this past week, small traders/speculators added to short (bond) futures positions.
If there’s a signal bonds are stretched, ready to reverse, it’s the little-guy just now getting in (going short) …. right at the bottom; as usual.
Note: Posts on this site are for education purposes only. They provide one firm’s insight on the markets. Not investment advice. See additional disclaimer here.
Note: Posts on this site are for education purposes only. They provide one firm’s insight on the markets. Not investment advice. See additional disclaimer here.
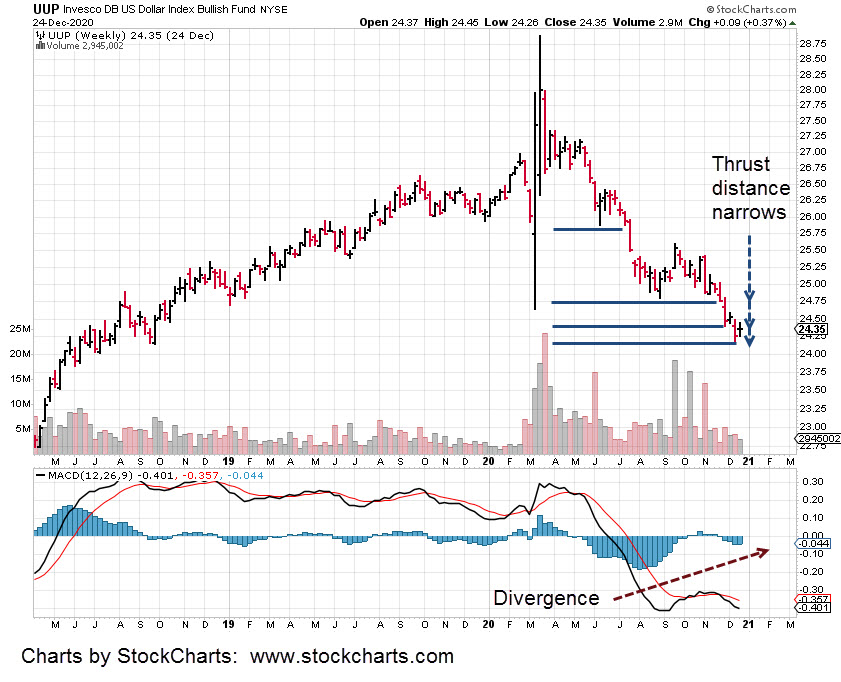
The downward thrusts in the dollar have run their course.
The weekly chart of UUP, shows successive narrowing of distance traveled to the downside.
The bears may have reached exhaustion at the same time MACD shows a bullish divergence.
Couple that with extreme shorting from the speculators; the trap is set, ready to close.
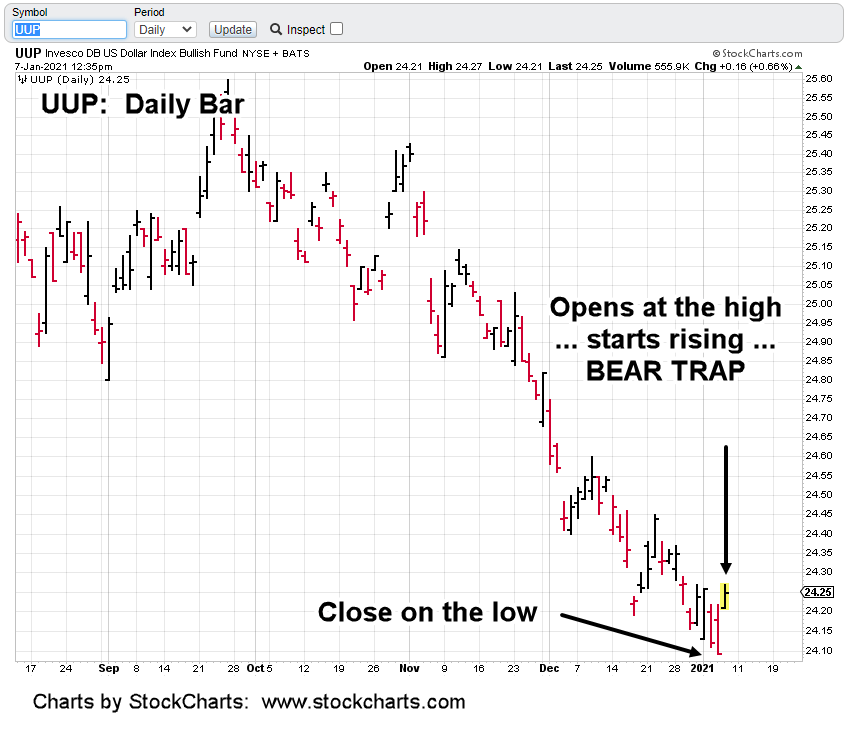
From a technical perspective, note last week’s price action was inside and at the top of the price range from the week prior.
Looking at the week before that, we see price action was inside but at the bottom of the range of the week prior.
These are subtle clues; there’s a change in character.
As mentioned in previous updates, it’s all happening during holiday weeks when everyone (almost everyone) is distracted.
No matter what happens on the political side, it’s likely to be chaos. February, is setting up to be very different from now.
We’re using Livermore’s strategic approach to the markets. That is, figure out what’s going to happen in a big way … then get in position.
Built into that approach is recognition there will be market outages, trading halts, communication interruptions and natural disasters.
The one thing that may separate this site from others, these (potential) events are taken into account.
Seismic activity is picking up in a big way right along with volcanic eruptions. A major eruption that will block the sun and kill-off global harvests or planting, may be in the works
The “Christmas Bomb” cut communication lines … which by the way is the very first objective during any battle; cut the enemy’s communications.
Matter of fact; that could be the ‘reason’. A test to see how badly communications were disrupted; how quickly they recovered.
Continuing on with potential disruptive events; There were broker outages on November 9th, when the market opened sharply higher.
If it happens on the way up, it will happen on the way down.
Cyber attack has already been stated as the next gala event the elite have planned.
There’s not one market analysis site known to this firm addressing those potentials or any others.
In that sense, The Danger Point, is unique.
Obviously, there are no guarantees. Anything can happen. If one wants to day-trade, go ahead but we’re not interested.
When or if all this (or a variant of it) happens simultaneously, the general pubic is going to be stunned.
It’s possible they will see their investment accounts wiped out in a matter of weeks.
The positions remain unchanged and listed below. The look is different as it’s taken from the firm’s own trade spreadsheet. Absolutely not advice and not a recommendation.
Note the initial stop followed by the current stop.
Note: Posts on this site are for education purposes only. They provide one firm’s insight on the markets. Not investment advice. See additional disclaimer here.
That’s part of the title from the Energy Sector report, linked here.
Those exact words were used just hours prior, in the pre-market update.
“Downward pressure is increasing.”
The short position in the sector is being maintained via DUG (not advice, not a recommendation).
The stop is set to be moved after today, based on price action.
Using USO as the proxy, oil is pushing a little higher as of this report (12:41 p.m., EST) probably because the dollar’s probing new lows.
Even though the dollar’s at lows, action thus far is reversal. A UUP close above 24.38, may signal trouble for those that are short.
The markets continue to be stretched to extremes. Based on data thus far, Energy Sector appears to be reversing (again) first.
Since that sector’s in a long term down-trend, XOP reaching its highs way back in June of 2014, we’ll remain focused on DUG.
Note: Posts on this site are for education purposes only. They provide one firm’s insight on the markets. Not investment advice. See additional disclaimer here.
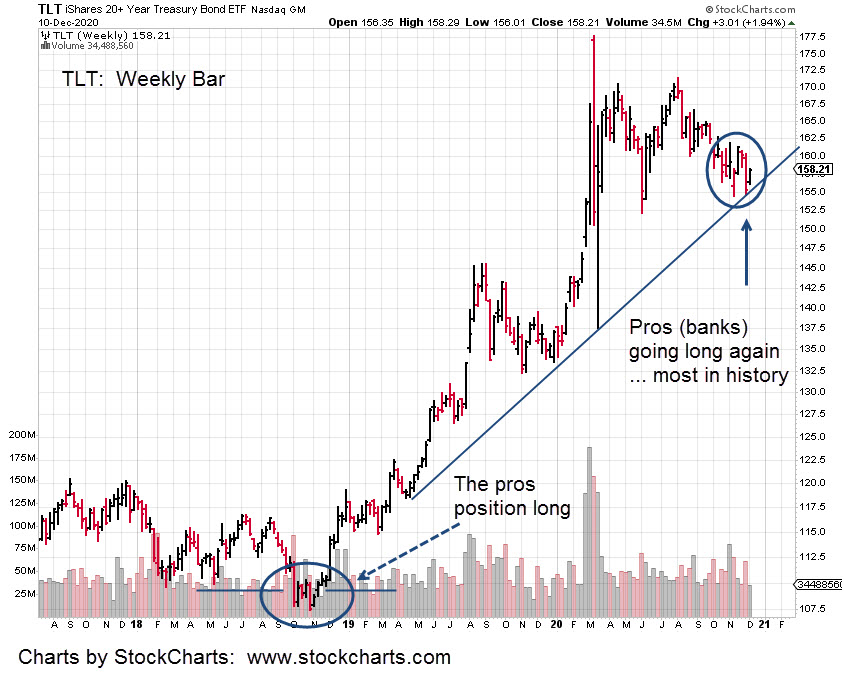
One recent example; the bond move from late 2018, to early 2020.
During the low from October 2018 to November that year, were reports of professionals opening huge long positions.
At the time and as the weeks went by, it appeared that nothing was happening.
The delay would have caused the typical i-phone addicted ‘tweeter’ to lose interest many times over.
When it finally took off, bonds staged a huge directional move that lasted over a year.
Such moves are rare and require the ability to wait. Wait to get in and wait for the move; minimize transactions.
Each market transaction is an opportunity for error. Minimize the transactions and by definition, the errors are minimized as well.
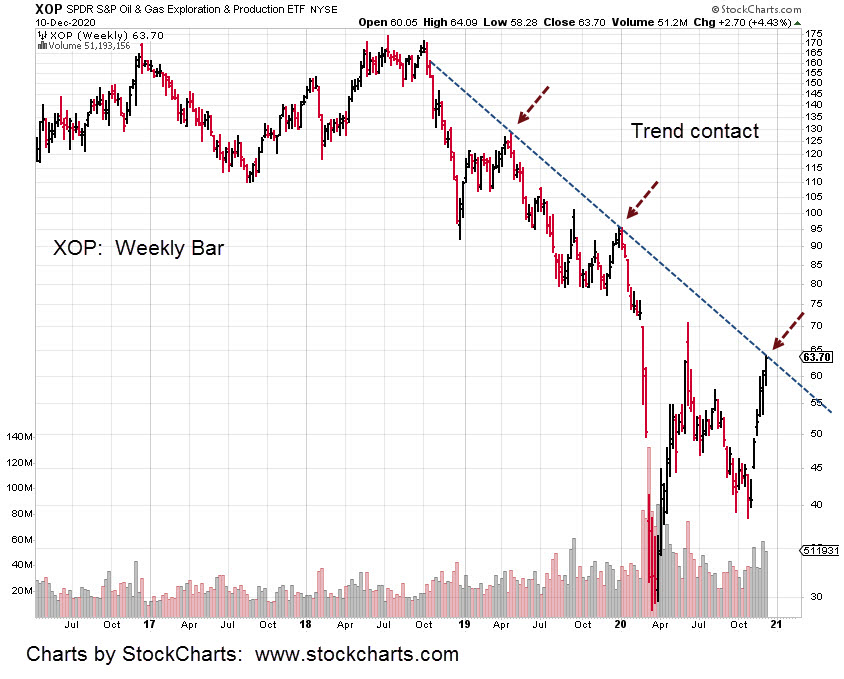
That brings us to oil and more specifically, XOP and DUG.
The nonsense being promulgated by the financial press is that oil is moving higher on ‘hopes’ for an economic recovery.
Maybe injecting the world-wide population with potentially DNA altering technology (not even tested on animals first) for an ailment that does not exist will miraculously launch some kind of pent up consumer demand.
No matter. Oil and its attendants keep moving higher with the dollar moving lower.
Even with anecdotal evidence from an Oklahoma oil field worker (commenting on a Van Metre update) that was later confirmed by the EIA report did not cause oil to move lower … yet.
That is, until today.
The dollar attempted to continue its downtrend yesterday. Oil spiked as did XOP to the upside and DUG to the downside.
This morning is a different story. Dollar proxy, UUP is trading (pre-market) right at its highs of the last session in an apparent reversal.
Oil along with XOP is down, with DUG up.
Looking at XOP, we see it’s hitting a long-established trend line.
With the dollar, bond, and overall market extremes, no recovery in sight and more probable, another (and complete) collapse; this may be the spot (not advice, not a recommendation) to position for medium to long term on the short side.
That’s exactly what the firm has done. Looks like our position was a day too early as we sat through yesterday’ spike lower in DUG.
Volume remained heavy for that DUG session. Weekly volume is looking to be the largest (big-money moving in) since at least 2015.
Note: Posts on this site are for education purposes only. They provide one firm’s insight on the markets. Not investment advice. See additional disclaimer here.
The dollar has reversed and is now testing the lows.
Conversely, when we look at the price action of gold (GLD) its collapse exactly mimics the dollar’s reversal.
Taking into account the futures market activity in gold, it made new daily highs last week during the overnight session, Sunday-to-Monday.
Using that knowledge on GLD, (adding it to price action) it retraced to 38%, of the recent down move this past Friday.
If we’re in a real bona fide reversal of the dollar and gold (posting more confirmation on gold tomorrow), then expectations are for continued gold downside during the coming week.
The dollar, bonds and gold, at this juncture are moving in tandem: Dollar and bonds up, gold (and silver) down.
Note: Posts on this site are for education purposes only. They provide one firm’s insight on the markets. Not investment advice. See additional disclaimer here.
If the dollar is going to collapse, this is the place.
Both weekly and daily price action (UUP) closed at new lows. Gold and silver have moved up in counter action.
However, if the dollar’s going to rally, this is the place as well.
The current uncertainty in the U.S. is all part of the equation. The emotions of the populace are being tossed about at will.
The plan is to (always, no exceptions) get the herd pointed in one direction so that a small fraction of speculators can establish their positions cheaply and with low risk.
When it comes to gold and silver it’s obvious where the herd is positioned. They are ‘all-in’, waiting for the precious metals rally to continue.
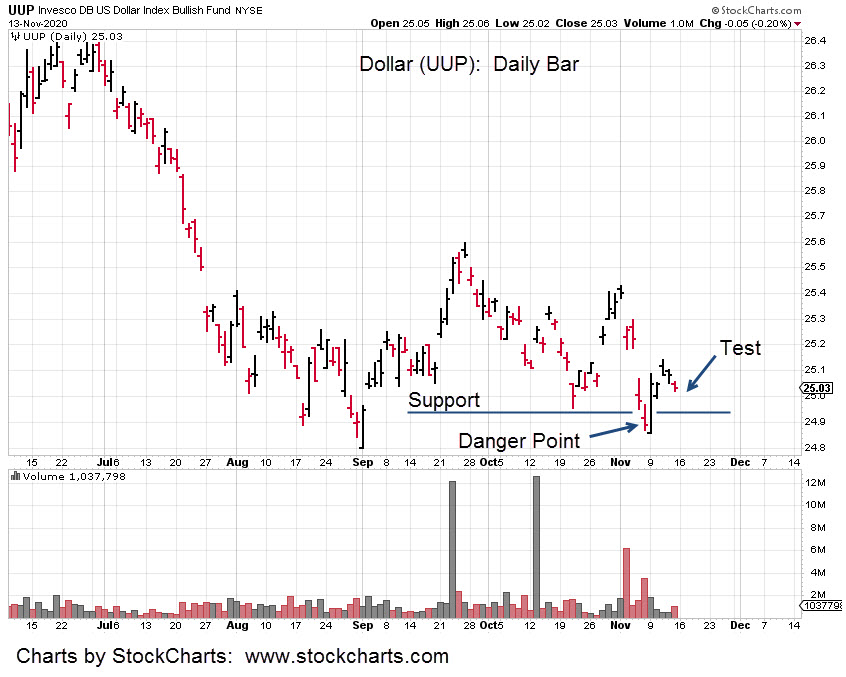
The dollar, UUP is at the danger point. A small move in either direction may be the deciding factor.
Looking back at the historical literature available, it was Livermore that coined the term ‘danger point’. It was Wyckoff that published the interview with Livermore where he used the term.
The take-away is, markets do not change. The same (similar) price action can be observed on charts that are a century old as compared to charts today.
Considering the UUP weekly trading range shown, it’s at the extreme low.
There’s been no significant upward testing of the wide range. Markets like to test. That’s what they do.
Based on empirical and technical factors in prior updates, we’re anticipating a dollar rally and in turn, are short the Junior Miner’s, via JDST (not advice, not a recommendation).
Futures markets open in a few hours. We’ll see if the current position will need to be exited at tomorrow’s open or if we’ve analyzed probabilities correctly.
As Livermore said, ‘you don’t know until you bet’.
Note: Posts on this site are for education purposes only. They provide one firm’s insight on the markets. Not investment advice. See additional disclaimer here.
The short position in JDST was exited during yesterday’s session with a decisive ding to one of the trading accounts.
Obviously, something was not analyzed correctly.
Pulling out to a larger view and looking at the correlated markets; bonds, the dollar and gold, it appears that bonds are moving higher first.
It was probably a head-fake to think the dollar will move exactly in tandem. That was the error plain as day, now.
The second error was not to see the first error. Enough said.
In fact, after yesterday’s session we see the dollar might be in the process of testing its trading range lows.
The dollar and the mining indexes, at this point are inversely correlated.
The dollar was down sharply. The miners were up in an opposite move.
The dollar (UUP) chart below shows a potential forecast. If UUP pushes lower from this point, it sets up a reversal condition (penetrating minor support) before it contacts major support.
Correspondingly, the miners and gold would be moving higher … for now.
Note: Posts on this site are for education purposes only. They provide one firm’s insight on the markets. Not investment advice. See additional disclaimer here.
As expected from the November 1st, update, gold pre-market shows a gap-higher open. Trading is around 178.80 – 179.00 which is a little above the resistance area shown in the original chart.
After the first hour of trading, the plan is to provide an update to see if there’s still a possibility of a reversal at this juncture (not advice, not a recommendation).
Correspondingly, the mining sectors, GDX, GDXJ are up in pre-market with inverse DUST and JDST, down.
However, the big hitter, NEM is right at a 50% retrace off the lows of October 28th. This is a possible area to stall and potentially resume a downward (or sideways) trend.
Other market actions that may have significant impact on silver/gold, are the four-standard deviation in the bonds to the short side.
As Steven Van Metre indicates, none of us reading this (in our lifetimes) are likely to ever see a set-up like this again. It’s an historic extreme.
Bonds are down in pre-market along with the dollar … using UUP as the proxy.
The dollar has bottomed and is now in position to rally; completely opposite the established consensus.
At least twice now, Van Metre has mentioned Wyckoff in his updates. He appears to be well aware of the significance.
In other markets, a position was opened in nat-gas, UNG at the last session. That position was closed in the pre-market session with a slight ding of -1.2% to the managed account.
Even with record cold hitting large portions of the country, nat-gas can’t seem to get going to the upside. Now, with its current action there may be a probability of lower prices (or stagnant action) going into winter.
We are leaving nat-gas alone for now and focusing on the historic bond set up and the potential effects when it all unravels.
Note: Posts on this site are for education purposes only. They provide one firm’s insight on the markets. Not investment advice. See additional disclaimer here.