Project Stimulus: First Trade

The first objective on the newly announced ‘Project Stimulus’, is protect the position.

As yesterday’s announcement stated, we’re taking the stimulus payment and trading a separate account.

The trading techniques to be used are presented on this site.

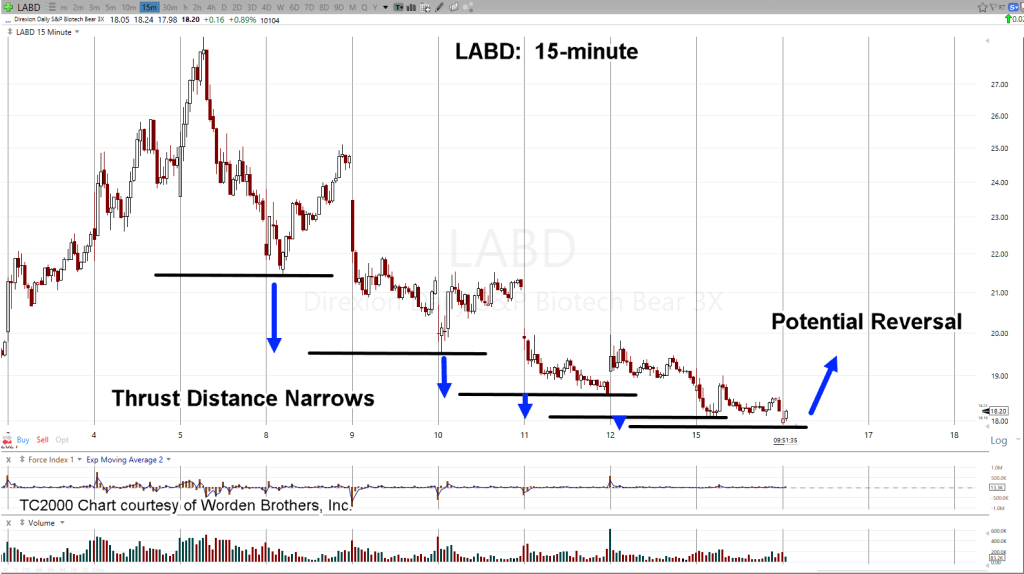
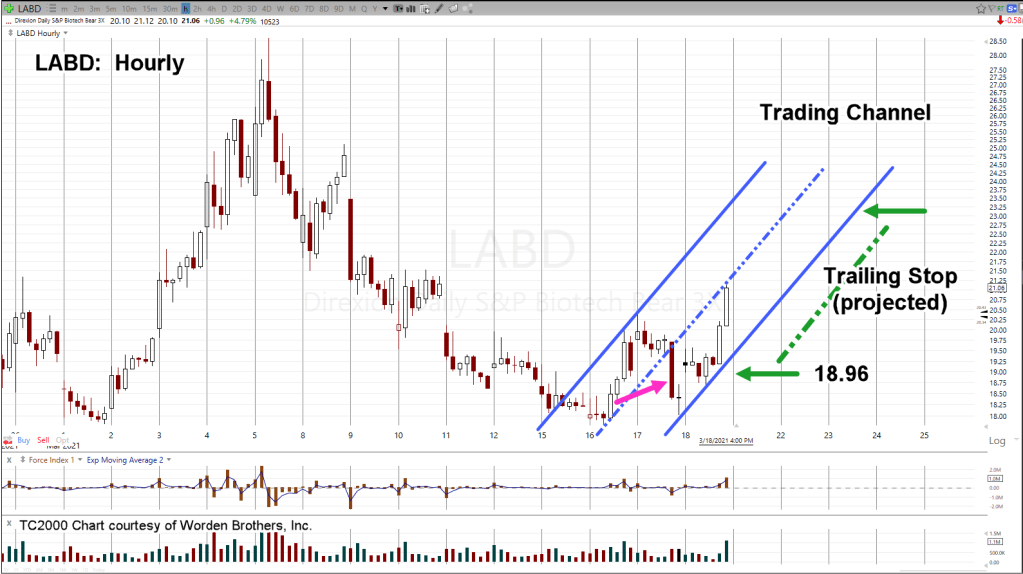
The magenta bar shows the entry at LABD 18.835 (not advice, not a recommendation) opened during the Fed speech this past Wednesday.

The reason for the entry at that time was two-fold.

First:

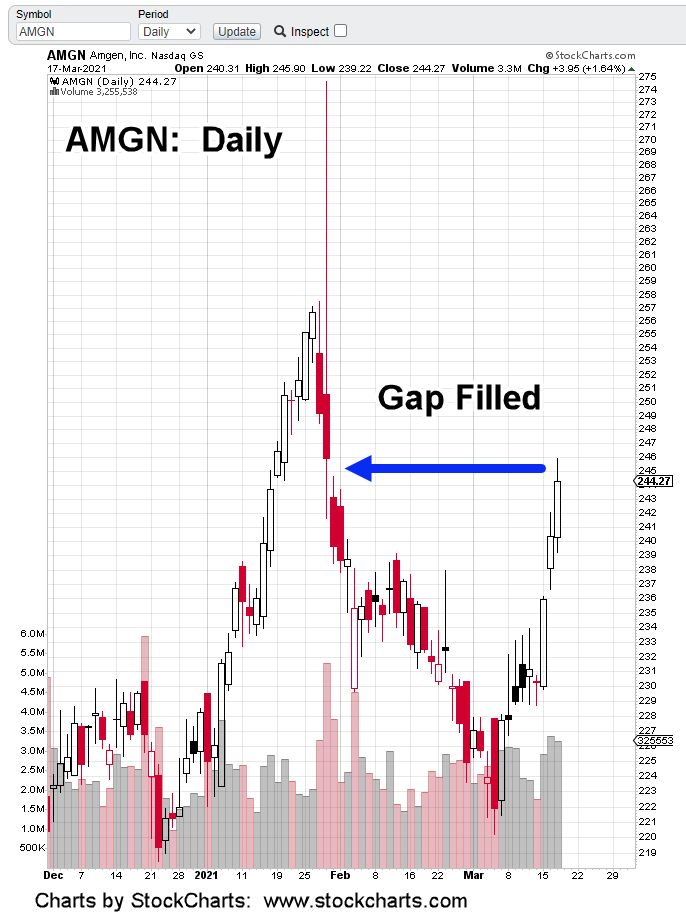
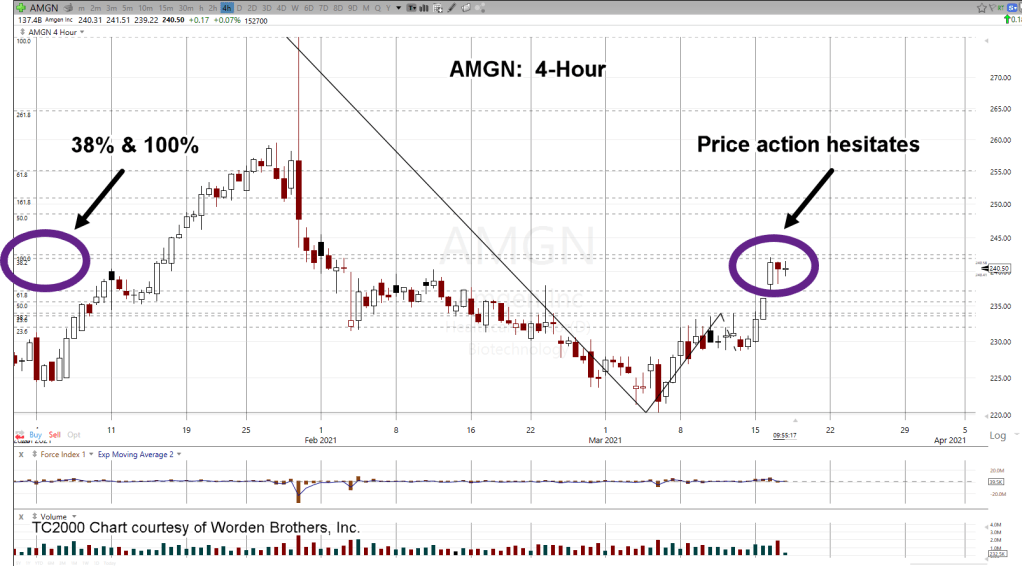
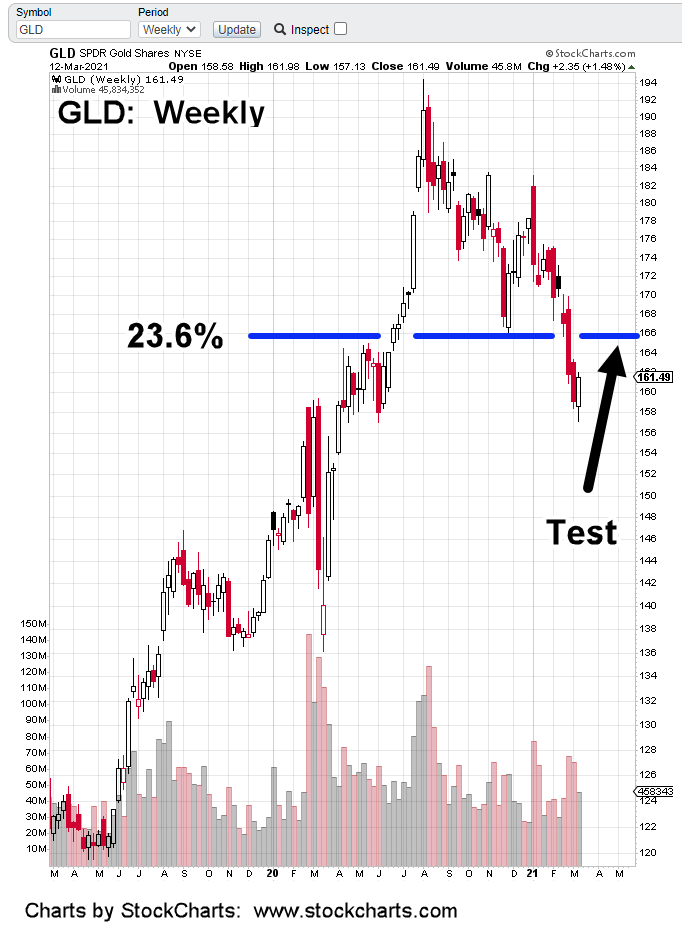
Biotech IBB was already at 50% retrace and had rejected that level once.

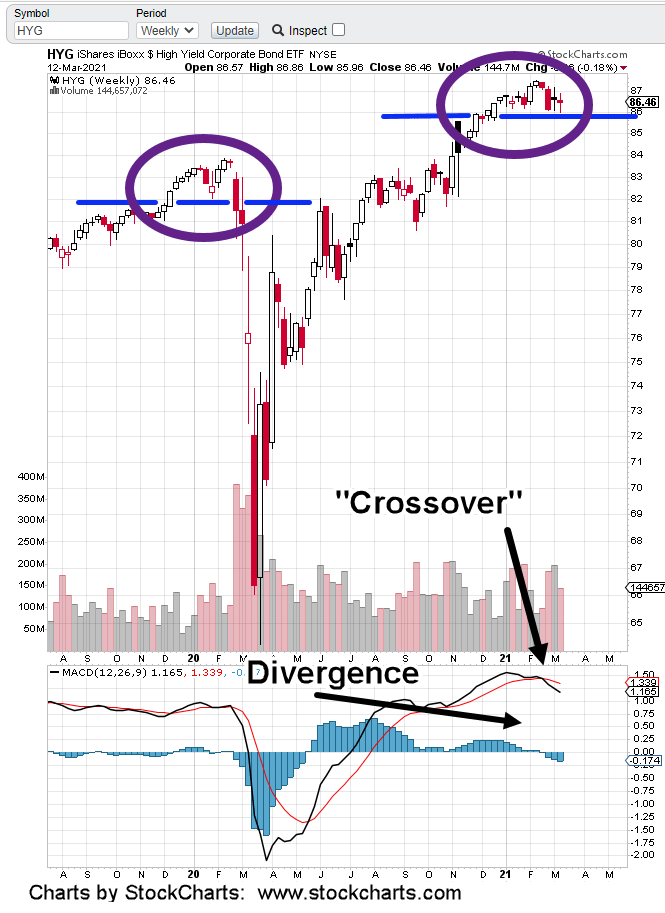
Monthly and weekly momentum MACD, indicators were (and are) pointing down; giving extra weight to a potential reversal.

Second:

Empirical data (i.e. experience) gathered over a thirty year period had shown, whatever direction the market took during a Fed speech, was quickly reversed in the coming days:

I’ve labeled such events as “Fed-Fake”.

At this point, the position is well in the green, closing at $1,552, yesterday. We’ll be putting in a hard stop at 18.96, shown above.

If we’re in a sustained reversal, it’s not unreasonable to expect price action to get back to previous near-term highs (lows for IBB).

Using highly leveraged LABD (not advice, not a recommendation) that would equate to about a 50% gain.

Stay Tuned

Note:  Posts on this site are for education purposes only.  They provide one firm’s insight on the markets.  Not investment advice.  See additional disclaimer here.

Project Stimulus

A check for $1,400, figuratively just came in the mail

We’re going to take that, trade a separate account, see where it goes.

Six-percent of those surveyed at this link say they’ll ‘invest’ their stimulus in the markets

So, we’ll join them. Mater of fact, yesterday was the start.

With 74 shares of LABD, entry point @ 18.835, we start the project; not advice, not a recommendation.

74 shares at 18.835 equals $1,393.79 … good enough.

Details such as account targets, objectives, equity curve and trade execution process, to be announced.

As of this post (2:21 p.m. EST) today, the balance is up to $1,465 … so, it’s off to a good start.

More later.

Note:  Posts on this site are for education purposes only.  They provide one firm’s insight on the markets.  Not investment advice.  See additional disclaimer here.

Gold (GLD) Path to 166

Early action GLD points to a rebound, target area 166.

The 30-minute charts shows a push below minor support (black line) that’s retracing.

Any time a market pushes below established support, it will attempt to ‘spring’ off that support level.

In this case we’ve already identified the 166 area as the target.

At this juncture, a GLD target of 166 would correspond to an April ’21 futures target around $1,765.

Note:  Posts on this site are for education purposes only.  They provide one firm’s insight on the markets.  Not investment advice.  See additional disclaimer here.

AMGN, Gap Filled

Price action pushed past yesterday’s analysis to fill a price gap from February.

What’s next is the question.

The answer may be in the pre-market, where AMGN is down -1.25% and inverse fund LABD is up +4.7%

If biotech IBB pushes below yesterday’s low of 154.45, we’ve got tentative confirmation the reversal (which tested its highs yesterday) is going to continue.

We remain short this sector via LABD (not advice, not a recommendation) with a hard stop @ 17.80

Charts by StockCharts

Note:  Posts on this site are for education purposes only.  They provide one firm’s insight on the markets.  Not investment advice.  See additional disclaimer here.

As Promised, Amgen

AMGN’s at a confluence of Fibonacci projections.

Yesterday’s update hinted that AMGN was in a special situation. This is a brief detail of conditions.

First, let’s understand that momentum indicators, MACD on monthly, weekly and daily, all point higher.

If we’re at the downside reversal, the inflection, we’re documenting in real time how it’s taking place.

On the chart, two Fibonacci tools are in use; a retrace tool and a projection tool.

The retrace is from the all time high posted on 1/28/21, to the most recent low on 3/4/21.

The projection tool has been placed on the recent upward action from that low and estimating where the a-b-c (corrective) waves are terminating.

The market itself determines what levels are important. This is one of the main Wyckoff tenets presented by him over a century ago.

It’s clear price action is hesitating at the confluence of a 38% retrace and 100% projection (‘a’ and ‘c’ waves equal) on the chart.

Since AMGN is the largest cap in the IBB, ETF, its behavior has an outsized effect.

A downside reversal from this point, the 38% retrace level, would indicate significant weakness for AMGN.

We also have today as Fibonacci Day 34, from the all time high.

The retrace high may have been yesterday or we may get it today … right around 2:00 p.m. EST, at the Fed announcement.

Update: As this was being written, AMGN just posted a new retrace high.

Stay Tuned

Note:  Posts on this site are for education purposes only.  They provide one firm’s insight on the markets.  Not investment advice.  See additional disclaimer here.

Pre-Market: Biotech Lower

Biotech has reversed.

Inverse LABD, higher in pre-market, approx: +5%

There are essentially two scenarios:

First, IBB is retracing, gathering fuel for new highs

Second, IBB has reversed and is heading much lower

Target levels to be identified and reviewed in a subsequent update.

Charts by StockCharts

Note:  Posts on this site are for education purposes only.  They provide one firm’s insight on the markets.  Not investment advice.  See additional disclaimer here.

Biotech 50% Retrace

Biotech pulls back 50% and the bulls look tired.

Update 12:23 p.m. EST, noted below in red

The 15-minute chart of inverse fund LABD shows how successive moves lower (higher for IBB) have covered less distance.

It’s very early in the session and price action at this moment is fighting it out at LABD 18.00, area.

We’ve maintained our short position (not advice, not a recommendation) but have the sense, if there’s not a reversal at this point, IBB could be working up for new all time highs.

This is the danger point.

Current LABD low for the early session is 17.91 … a good place for a stop.

LABD pushed down to 17.80, early in the session before reversing.

It has just passed 18.28, a new hourly high. AMGN to be covered later, at important inflection point (down).

Short position via LABD maintained (not advice, not a recommendation), hard stop at 17.80

With markets at record prices, Fed announcement tomorrow, no more stimulus (likely), forbearance to end, possibility of the ‘speck’ blowing wide open, one gets the sense this may be an important reversal.

Note:  Posts on this site are for education purposes only.  They provide one firm’s insight on the markets.  Not investment advice.  See additional disclaimer here.

S&P 500, Danger Point

Early in the pre-market, SPY is trading unchanged.

Looking at the daily SPY close, we’ve got a tentative breakout just above resistance (black line).

Lower right of the chart shows upward thrust energy has declined significantly … right along with volume.

Yesterday’s update showed longer term momentum (monthly, weekly) for the S&P was pointed up. Continued price action drifting higher is possible.

However, if there’s a reversal in the making, this is a good place to start.

The buyers (volume) have backed off at this level; leaving the SPY hanging just above breakout resistance.

The SOXX, QQQ, and IBB are well off their highs and may be leading the way lower. Our focus remains on shorting biotech IBB, which is the weakest of the three (not advice, not a recommendation)

Charts by StockCharts

Note:  Posts on this site are for education purposes only.  They provide one firm’s insight on the markets.  Not investment advice.  See additional disclaimer here.

High Yield, The Canary

The canary in the coal mine could be High Yield, HYG

Since early last year, this site has been discussing growing parallels of the current market environment to that of August 1987.

Just recently, ZeroHedge began to pick up on the idea as well.

What’s becoming very obvious when looking at 1987, we’re in something much larger; possibly an order of magnitude (or two) larger.

Here’s the latest from Jeramiah Babe. Important time-stamps below:

2:15, Crypto (try it when the power goes out)

3:00, Inflation

3:30, Agricultural prices

3:40, Lumber prices

4:10, Middle Class destruction

5:00, Last longer than Great Depression

7:30, Dramatic shift (never to be the same)

10:00, “We’re in 2021 now. Anything is possible

A quick review of longer term momentum indicators on the major indices (or ETFs), below:

Technology based indices all have significant downside momentum.

The financial press may have pawned this off as ‘rotation’. Of course, that remains to be seen.

Our view, high yield tells us something much larger than a sector rotation’s occurring.

It’s possible, the most debt (interest rate) sensitive indices are reversing first which could be a sustained, long term reversal.

The HYG weekly chart pattern is similar to the prior reversal (magenta ovals). This time however, MACD has spent over nine-months in a divergence and has crossed to the downside.

There could be a new high … low probability but it could happen (after all, it’s at support). If it does, weekly MACD may post an even larger divergence.

In response to the HYG reversal, we’re watching (and are short) the biotech sector, IBB (not advice, not a recommendation)

Of the three noted above with negative momentum, IBB is the weakest. Last Friday’s action has tentatively confirmed the resistance areas and trading channel reviewed in this update.

Friday’s IBB lower action was nearly imperceptible but it was there. Major reversals can happen this way … a little at first.

Wyckoff said it in 1910, ‘It’s as if the weight of a feather can determine the next direction’.

We’ll see if there’s follow-through to the downside on Monday.

Stay Tuned

Charts by StockCharts

Note:  Posts on this site are for education purposes only.  They provide one firm’s insight on the markets.  Not investment advice.  See additional disclaimer here.

Gold To Rally ~ $1,660

If that happens, expect the usual suspects to ‘Go Postal’ on the hyperinflation narrative.

Johnny Bravo put it best when he said (to the effect) months ago:

We’re going to get hyperinflation. The question is “When?”

Looking at it a different way and in ‘Oligarch speak’.

The time for hyperinflation, is when the proletariat have exhausted their supplies of precious metals … most likely using it to buy food.

An engineered famine is being constructed; in process, as we speak.

Judging from comments on the financial sites, the public still thinks food prices are rising because of inflation.

There are exceptions (thankfully) like the comment area on ZeroHedge articles. Those few but growing number, understand exactly what’s happening.

So, what’s all of this got to do with the price of gold?

It’s perfectly natural and maybe expected that gold, GLD, after breaking support will rally back to test the 166 (~ $1,660) area.

Just like the incessant narrative on “The Speck“, which is drilled into the collective consciousness day after day (except maybe in South Dakota and Texas) so too, is the hyperinflation Weimar Republic narrative.

A Black Swan (as explained by Nassim Taleb) is a major unexpected event.

The flip side, a Black Swan is also a major expected event, that does not happen. That second definition is not commonly discussed.

What if hyperinflation never happens? What if there’s some kind of ‘transition’ before it has a chance to take hold?

If GLD tests 166, and reverses, downside targets are now 133 and then even lower at 110.

If that happens, there could be a market crash to go along with it.

With margin debt levels the highest in history, most if not all participants will be wiped out long before gold at $1,100 (or lower).

Silver and gold at fire sale levels and the public will be on the other side of the fence, turning in their precious metals hoard in exchange for worthless fiat dollars … just to survive.

It’s an oligarch’s dream come true.

Stay Tuned

Charts by StockCharts

Note:  Posts on this site are for education purposes only.  They provide one firm’s insight on the markets.  Not investment advice.  See additional disclaimer here.