Note: Posts on this site are for education purposes only. They provide one firm’s insight on the markets. Not investment advice. See additional disclaimer here.
Now, we have ‘the big short’, as reported by The Money GPS, doubling down on a possible even bigger short.
Is TSLA a good short opportunity or just a high visibility gamble; or maybe at this point in our history, just another psy-op?
How many minions are flagellating themselves over TSLA, anyway?
From a trading standpoint, TLSA could reverse from here. It could also gap higher into a wedge throw-over. With the weekly MACD showing no signs of erosion, probabilities are about equal.
Bad Short
Now, let’s look at another chart:
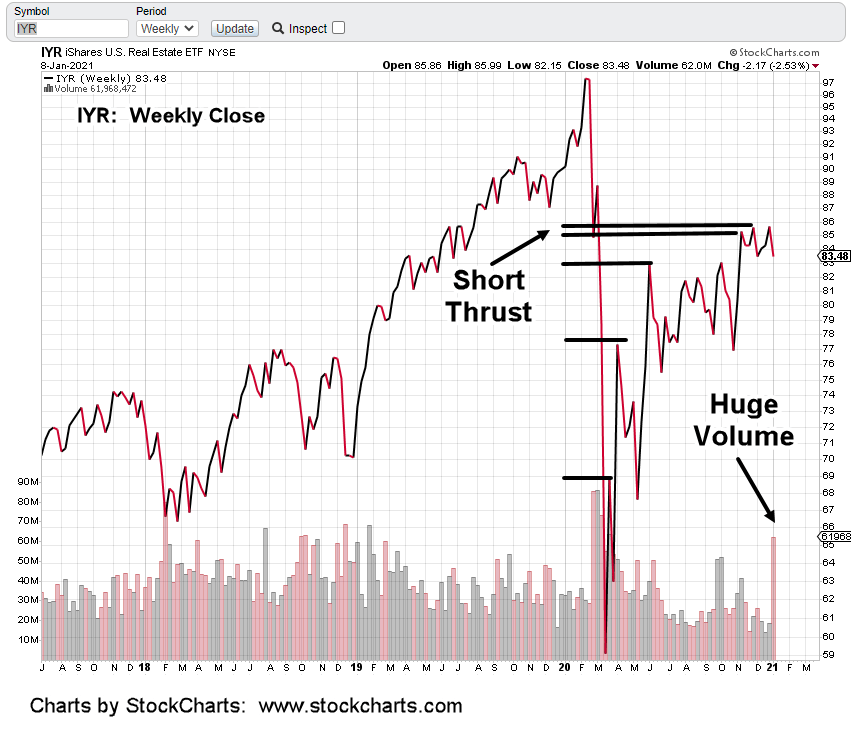
Real estate, IYR is showing classic signs it’s about ready to roll over.
Its been struggling for months at the 85-86 area and just yesterday, posted a new weekly low.
Yesterday as well, bonds reversed to the upside. Pre-market activity points to a higher open … solidifying the reversal.
On top of that, the dollar shows a higher open having (downward) tested its up-trend at the last session.
The list can go on but we see the difference.
One is a gamble (or even a psy-op manipulation of followers) and the other is a trade with high probabilities.
Good Short
The table below has current positioning (not advice, not a recommendation):
Special Update: 9:52 a.m. EST. Price action in DRV pushed to stop level and has recovered quickly.
Position is being maintained (for now) with analysis to follow.
Update: 2:21 p.m. EST. IYR looks to be headed to a 38% retrace at approx 84.25, level. All DRV positions exited. Will look to re-enter shorts at higher level, price action depending.
Note: Posts on this site are for education purposes only. They provide one firm’s insight on the markets. Not investment advice. See additional disclaimer here.
Then, today’s action is reversal with moderate volume.
On the dollar side, at first glance it looks like a terrible day.
Action was down 0.53%.
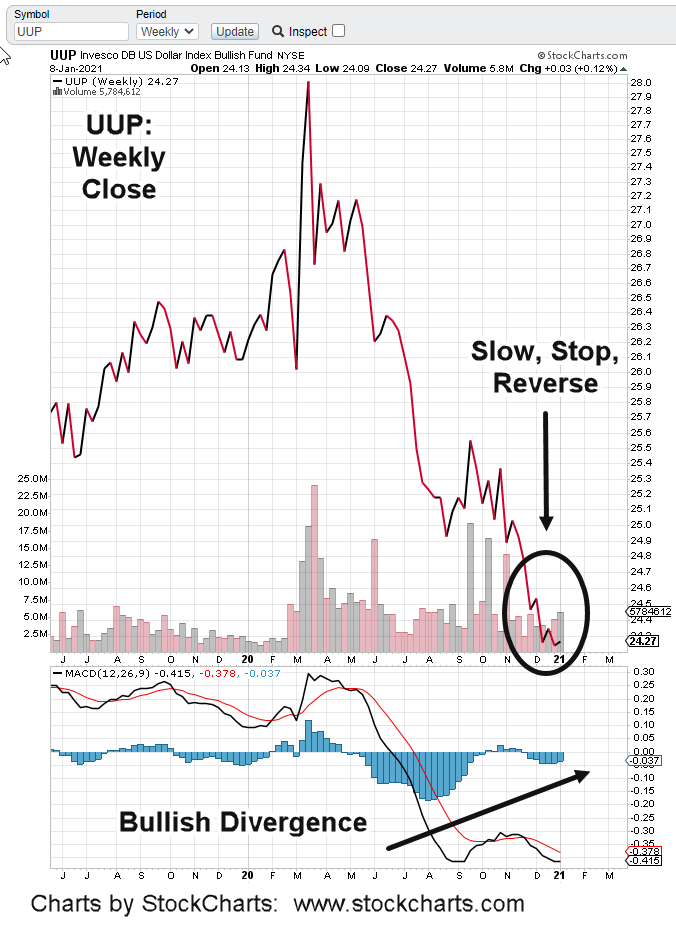
The reality is, UUP came down to test an up-trend line formed as part of its own reversal last Thursday.
Both dollar and bonds are in an upside reversal; the dollar looks slightly ahead by a few days.
Real estate (IYR) has rallied (sort-of) which may only be temporary; likely on the (false) belief lower bond yields are good for higher yielding sectors.
Not true when we still have (as Van Metre puts it), the ‘insolvency event’ yet to come; everyone going bankrupt all at the same time.
Anything can happen and the above analysis could fall apart tomorrow.
On the probability side, looks like we’ve seen the extremes in the major sectors; now ready for reversal pivots.
Note: Posts on this site are for education purposes only. They provide one firm’s insight on the markets. Not investment advice. See additional disclaimer here.
Under the radar, the sector (IYR) may be getting ready for a dramatic break lower.
The chart above is the 3X inverse fund DRV (inverse of IYR).
The table shows entries over the past few days; not advice, not a recommendation. Currently, the firm has no other open positions.
Early in this morning’s session, IYR posted a new daily low with DRV conversely, posting a new daily high.
At this juncture (11:23 a.m. EST), we’re in a very tight range (both tickers, IYR, DRV) that’s oscillating in an attempt to determine the direction of least resistance.
From a weekly momentum standpoint, MACD has been positing lower for two weeks and is near a zero crossing.
With that, we’re favoring the downside for IYR and upside for DRV.
The market’s hovering at all time highs … effectively masking the fact, air is going out of IYR.
Note: Posts on this site are for education purposes only. They provide one firm’s insight on the markets. Not investment advice. See additional disclaimer here.
Note: Posts on this site are for education purposes only. They provide one firm’s insight on the markets. Not investment advice. See additional disclaimer here.
The dollar has been inversely correlated since March of last year.
A reversal was identified in this report which thus far, has proved correct.
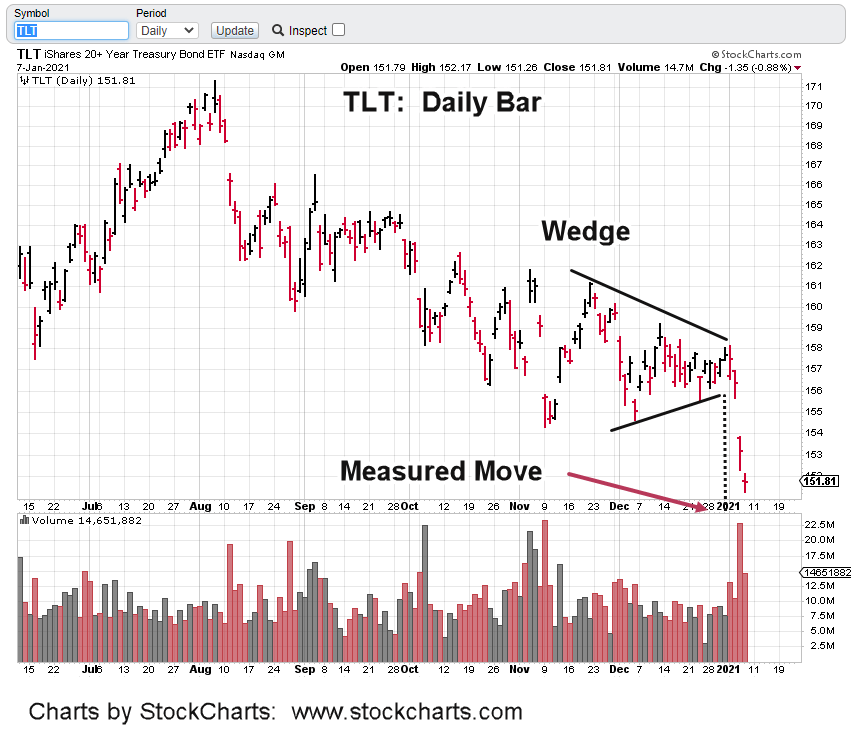
Bonds are also showing higher in the pre-market, having met a measured move (wedge) target last week.
The UUP, weekly close has price action slowing its decline, stopping and then reversing. That’s where we are now.
Weekly MACD ticked up (slightly) last week and higher open this morning, would confirm the divergence.
Market sentiment readings as reported by J. Bravo (time stamp 1:00) are literally, off the charts.
On top of that, internet scuttlebutt over the weekend shows at this juncture, absolutely anything can happen.
Having a market stance (or position) that includes possibility of power outages, banks going off-line, internet disruptions and general overall chaos, would seem to be reasonable.
In line with that, entries were made in DRV last week as shown (not advice, not a recommendation):
Pre-market activity for IYR, points to a lower open, DRV higher.
Note: Posts on this site are for education purposes only. They provide one firm’s insight on the markets. Not investment advice. See additional disclaimer here.
Note: Posts on this site are for education purposes only. They provide one firm’s insight on the markets. Not investment advice. See additional disclaimer here.
We have the usual suspects rolled out; providing expert analysis on why gold went down.
The answer is quite simple. It tested a trend break, then reversed.
If we look at the (close) chart of GLD, it broke an uptrend during the week of November 20th, last year; went lower and then back to test.
That test was rejected dramatically with Gold (GLD), heading significantly lower; getting whacked down over 5%, in just two days.
This is not bull market behavior.
Steven Van Metre’s assessment (at this juncture) that we’re in a deflation event is being shown correct. The lagging factor in the scenario is the overall market … still near all-time highs.
It’s true bonds broke lower (rates up) this week but that’s another event answered by technicals; the wedge formation, discussed here.
Both bonds and the dollar have set the stage for a swift reversal.
Just how that’ll affect an extended, obscenely overvalued, stretched, call options wild market with everybody all-in, is not known.
Getting back to Van Metre; he’s reported, during this past week, small traders/speculators added to short (bond) futures positions.
If there’s a signal bonds are stretched, ready to reverse, it’s the little-guy just now getting in (going short) …. right at the bottom; as usual.
Note: Posts on this site are for education purposes only. They provide one firm’s insight on the markets. Not investment advice. See additional disclaimer here.
As markets power higher, real estate topped last November; its been dead ever since.
IYR is telling us something. That something may be it’s about to be one of, if not the leader to the downside.
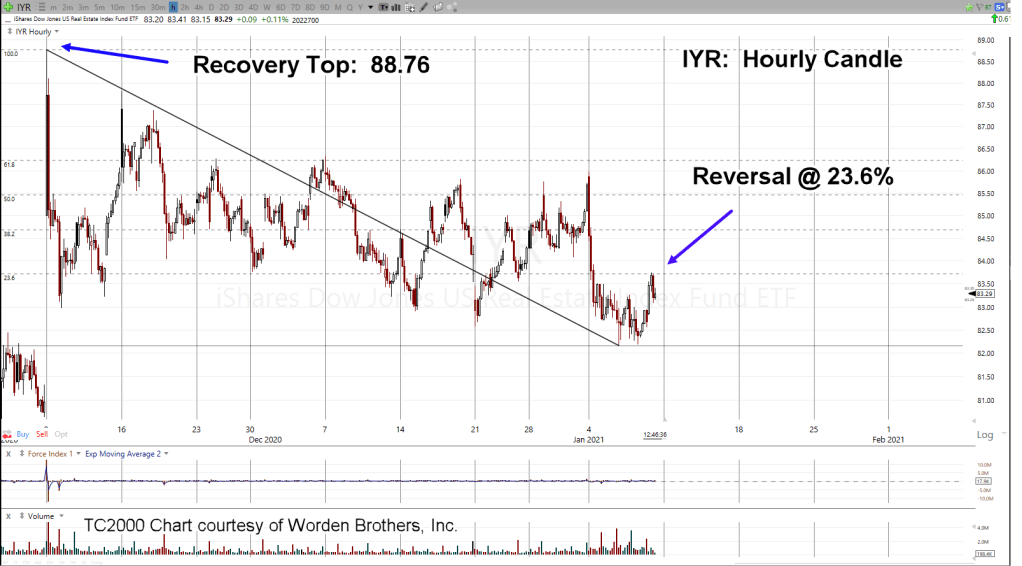
The last report said IYR is breaking down. This morning’s action was an upward test, then reversal.
Testing at Fibonacci 23.6%, (shown above) then reversing indicates severe weakness.
Inverse fund DRV (3X inverse IYR) is moving back into its prior trading range (11.00 – 11.50) after pushing lower in the early session.
Today could be the day. The day were real estate (IYR) begins a dynamic drop to much lower levels.
Note: Posts on this site are for education purposes only. They provide one firm’s insight on the markets. Not investment advice. See additional disclaimer here.
Note: Posts on this site are for education purposes only. They provide one firm’s insight on the markets. Not investment advice. See additional disclaimer here.