Buffett’s not on the list
After thirty-four years of researching the markets, focus has narrowed to three masters from the early 1900s; providing a solid framework for addressing the markets of today.
More detail on these masters can be found at this link.
Summarizing their knowledge as follows:
Strategy, Tactics, & Focus
This update demonstrates how those tenets are being implemented.
Strategy:
In Livermore’s fictional autobiography (Reminiscences), he muddled around for years before identifying his niche.
That is:
‘What’s going to (or what’s likely to) happen in a big way.’
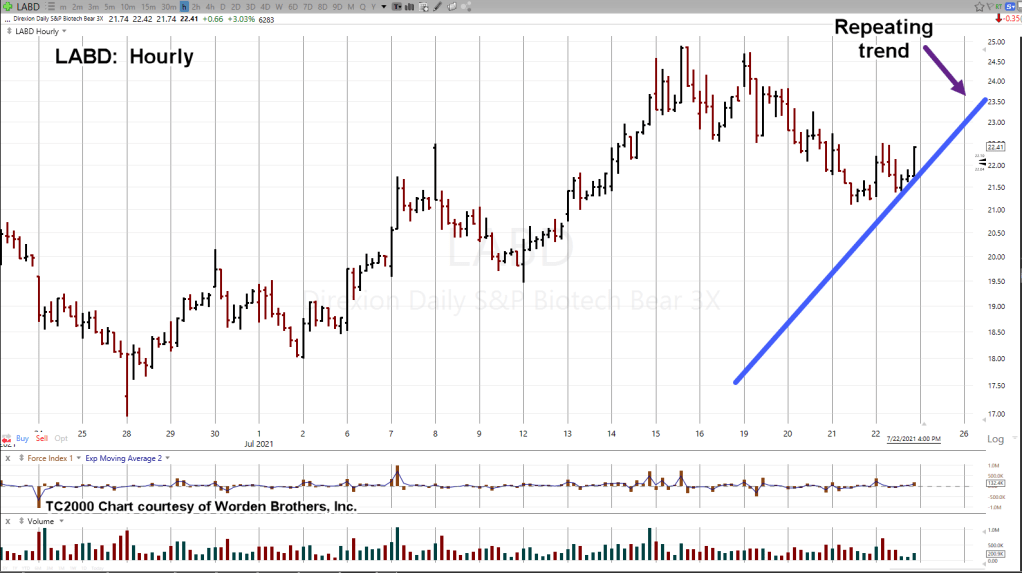
That insight has been used to identify the biotech sector as ripe for complete (and well deserved) implosion; more so than any other sector in the market.
For many months, the case continues to build for collapse.
Here’s just one more brick in the wall; providing even more support for implosion.
Tactics:
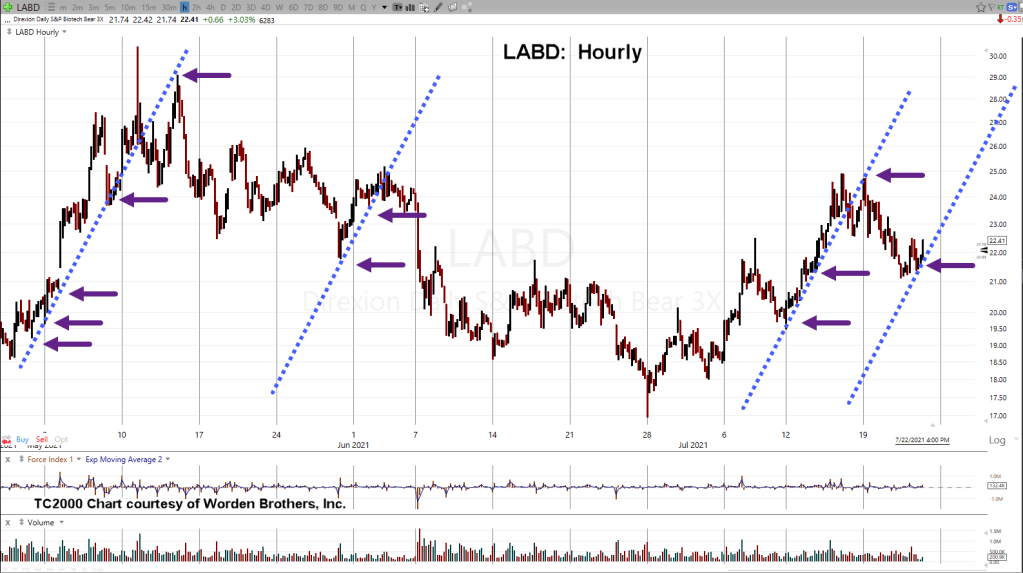
Wyckoff committed his entire professional life to decoding the market and its moves.
He is (as far as available data shows) the father of technical analysis.
Terms like ‘support’, ‘resistance’, ‘accumulation’, ‘distribution’, did not exist before is treatise, “Studies In Tape Reading”, published in 1910.
His bottom line:
Price is moved by a force of its own; having nothing to do (in a causal way) with fundamentals:
‘What is the market saying about itself.’
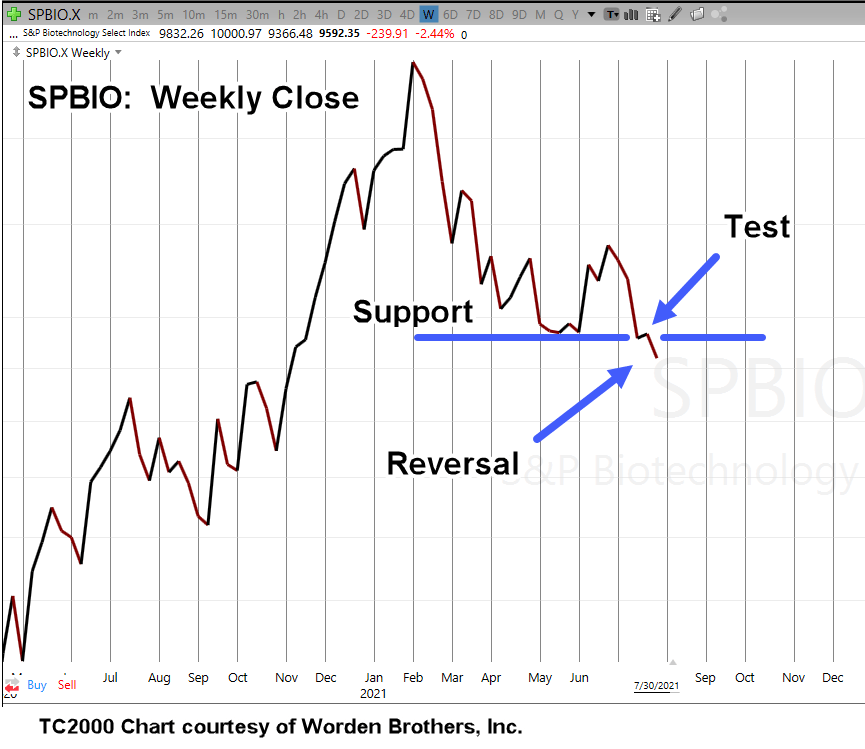
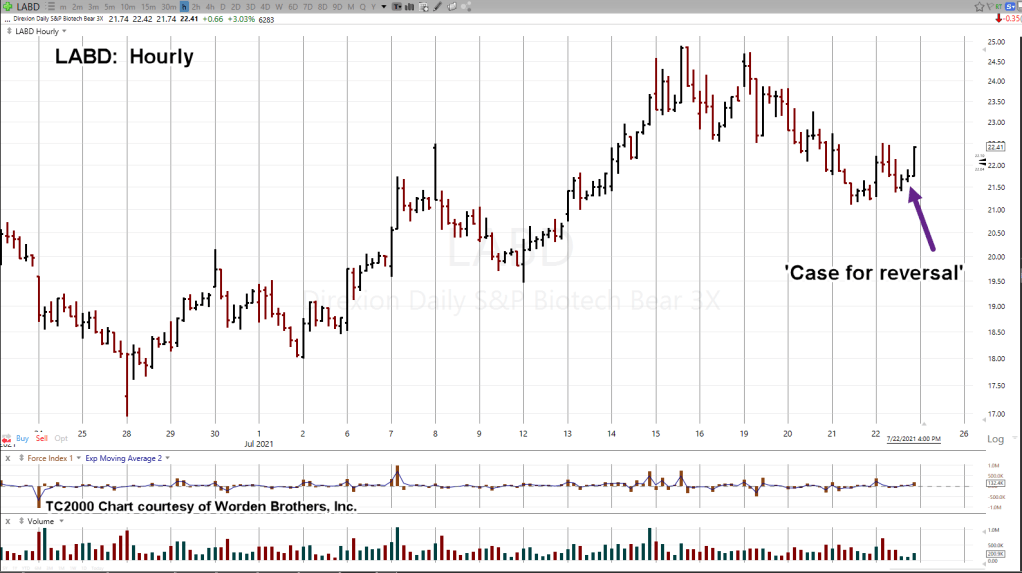
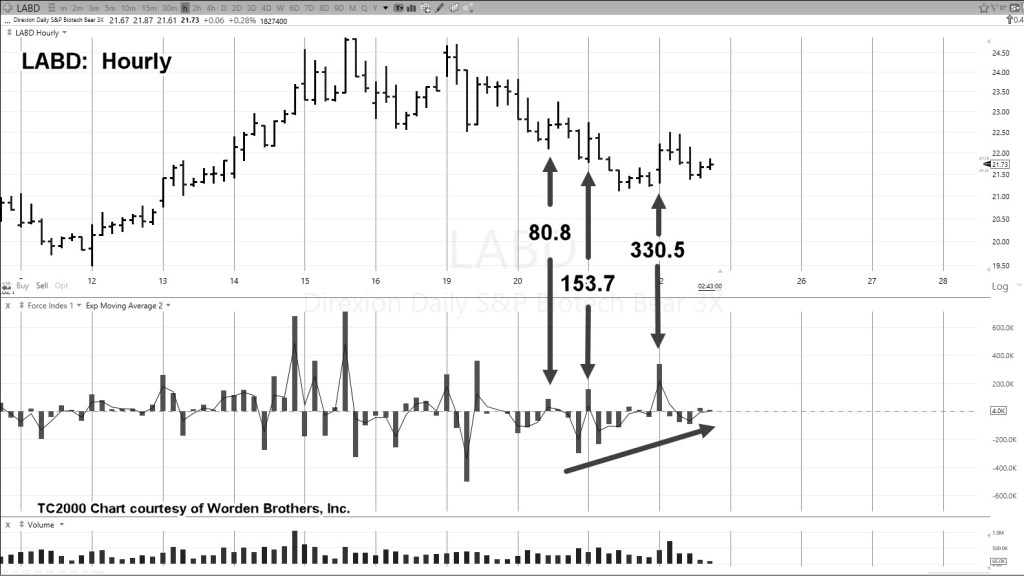
The biotech sector SPBIO, is tag-teaming with gold miners GDX (and GDXJ), for downside leadership.
SPBIO finished the week down -27.5%, from its February 9th (2021) high; running a close second to GDX, which finished the week down – 27.6%, from its August 5th (2020) high.
From a speed-of-decline standpoint, biotech’s in the lead.
Focus:
Loeb’s brutal admonition was: ‘The naïve, lazy, mediocre, ignorant and the incompetent “diversify”.
His follow-on corollary was: ‘Real market opportunities are few. If one is discovered, it must be used to its maximum extent.’
Loeb’s assessment of those in the market, is not much different from Wyckoff’s:
“The average man never makes a success of Tape Reading.
Right you are! The average man seldom makes a success of anything.” (emphasis is Wyckoff’s).
From the above list, ignorance can be fixed through determination, study, tenacity and the never-ending search for (market) truth.
The others, not so much.
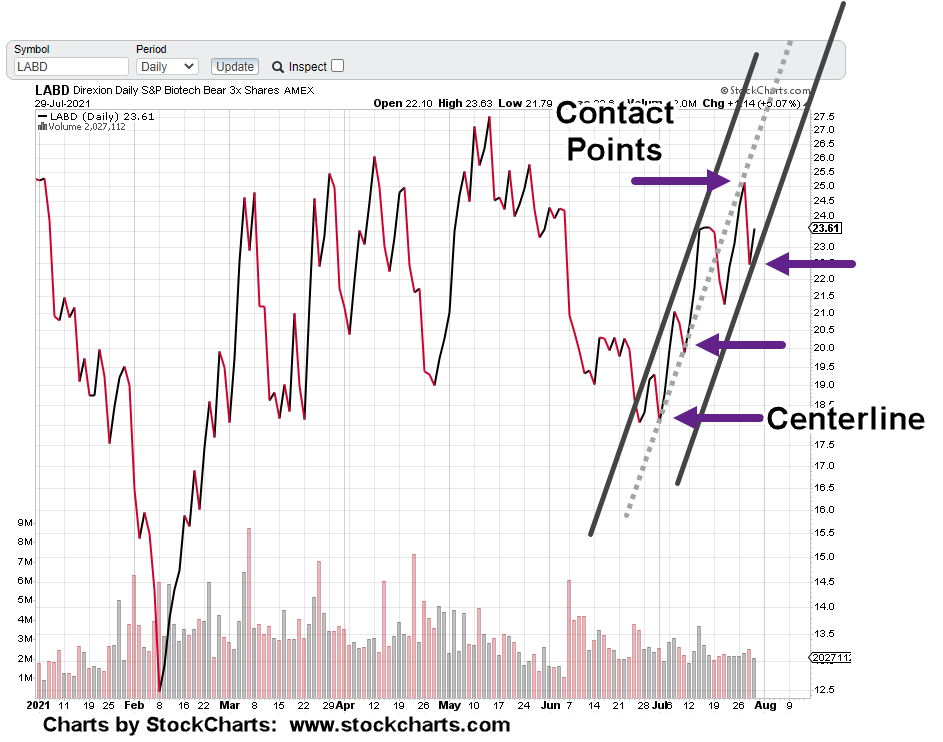
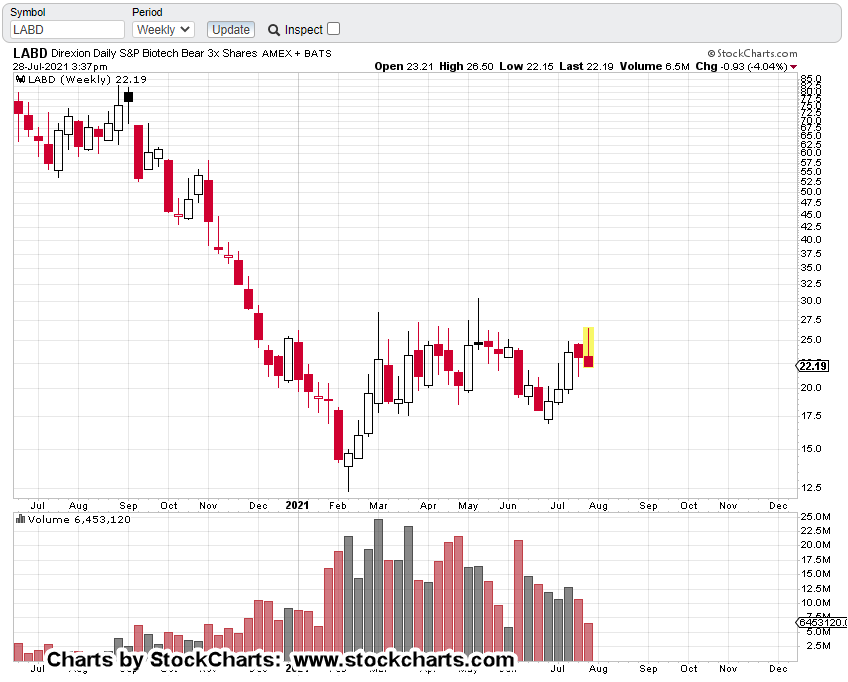
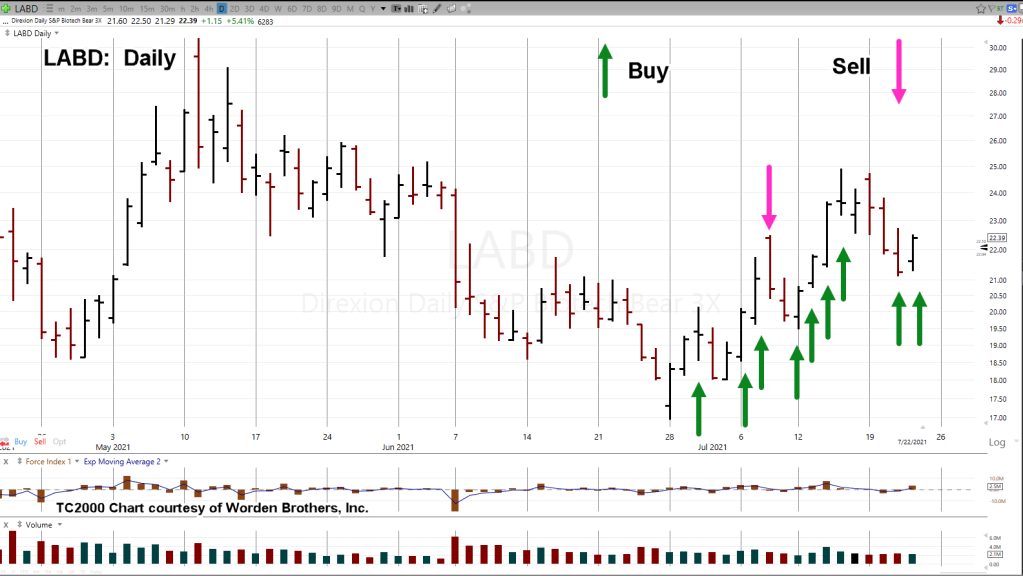
Using Loeb’s tenet, that is, ‘focus’, we’ve taken it and have gone short and continue to go short (not advice, not a recommendation), the biotech sector via LABD.
Summary:
There’s no guarantee the short trade will work out; yielding a significant gain.
Any number of things can happen:
Internet outage, power outage, terrorist attack, supply chain and transportation shut-downs … literally, anything.
However, being short (from a personal standpoint) is better than wringing one’s hands, cowering in fear, looking to the (bought and paid for) financial media to provide direction on what to do in this unstable environment.
Epilogue:
By using the life’s work of Livermore, Wyckoff & Loeb, its been determined, being short biotech (and possibly the mining sector) is the appropriate market stance.
With the caveat that even now, one might need to exit the trade; it still appears at this juncture, the on-going short (not advice, not a recommendation) is the most focused profit opportunity given the current environment.
Stay Tuned
Note: Posts on this site are for education purposes only. They provide one firm’s insight on the markets. Not investment advice. See additional disclaimer here.