In the overnight and early morning, gold futures GCZ20, posted a new daily high and a new daily low: Outside down.
Gold continues its move lower.

Before we can begin to get downside targets for gold, we have to go way back to the original start of the gold rally
Back to January 20th, 2001.
Gold reached a low near 254/oz – 255/oz.
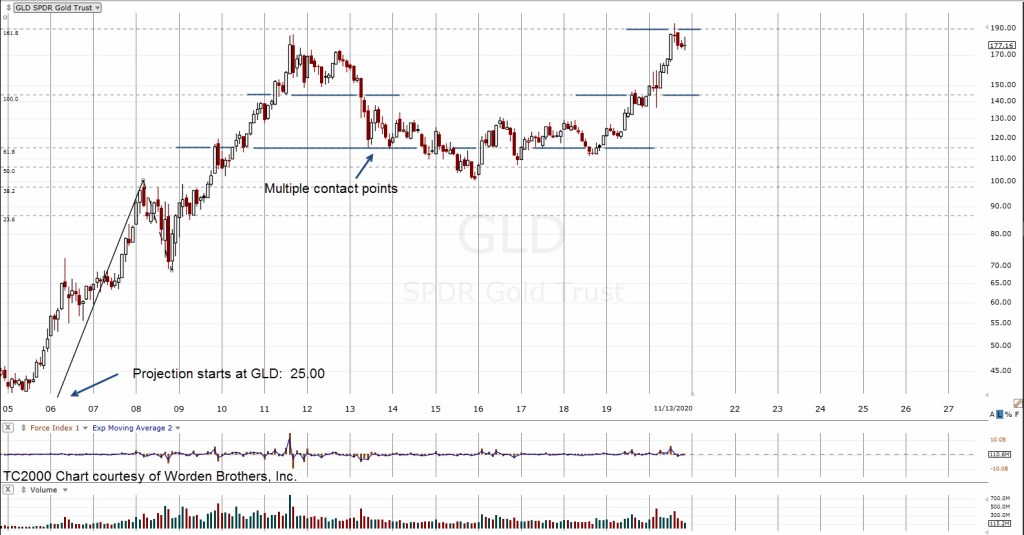
Using that knowledge, we can create a Fibonacci projection tool for the chart of GLD.
The GLD data on the chart does not go back that far. So, we have to improvise.
Taking the Fib projection tool down to the 24 – 25 area of the chart and then identifying a major top of the move during the financial crisis of 2007 – 2008, gives us the chart shown below.
Expandable version of both charts, here
Note the multiple price action contact points on the 61.8 projection. This area is an axis line. The market oscillated around this area for nearly 10-years, before heading on to new all-time highs.
The axis lines and reversal points on the chart provide confirmation we have selected the price action waves correctly.
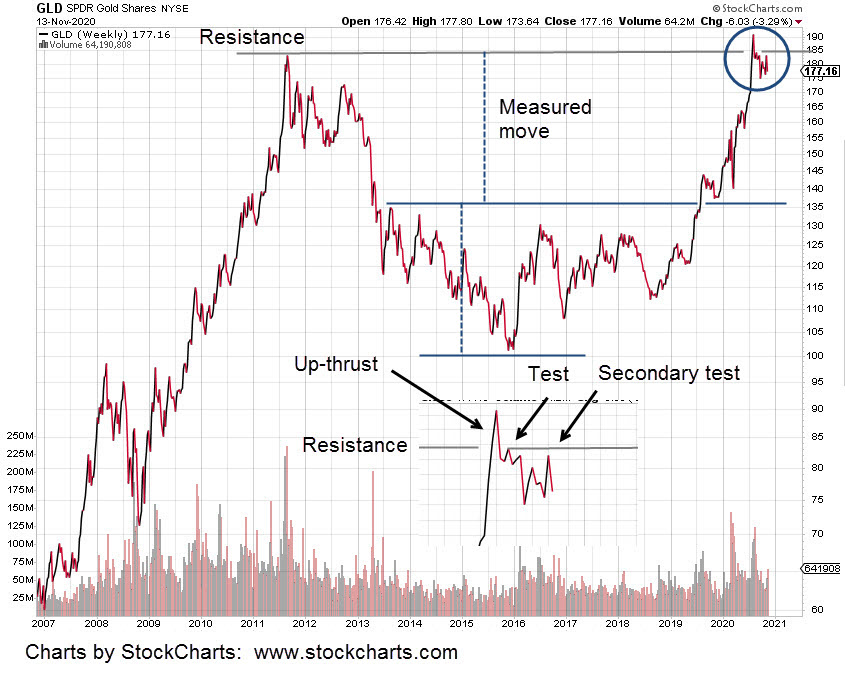
Using the same 25-area on GLD, we’re gong to remove the projection tool and use the retrace tool and then zoom in using the weekly chart.
That chart is below:

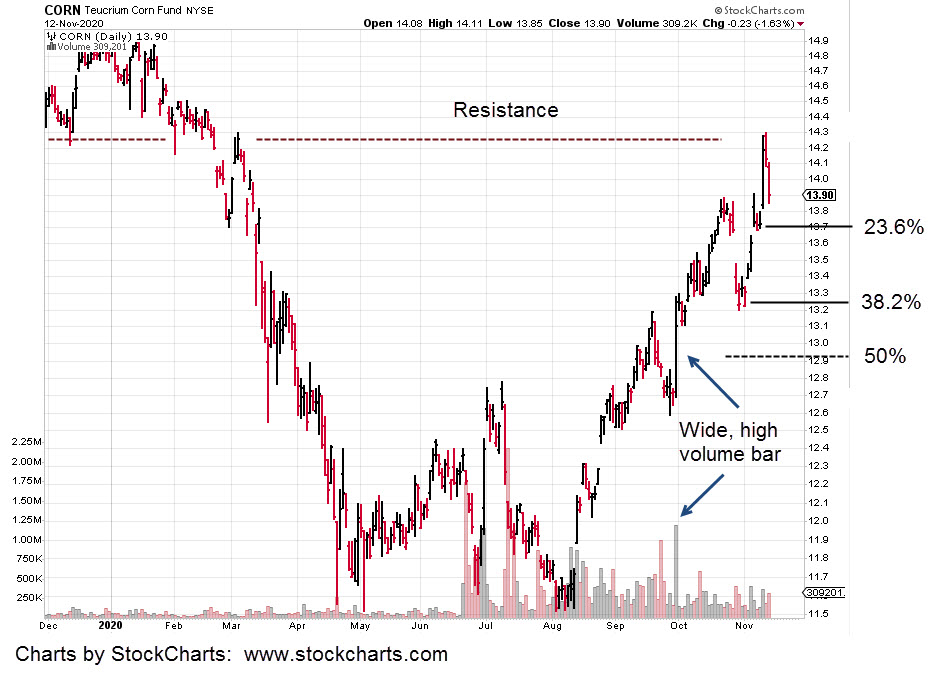
There is a lot going on with this chart. Note the wide, high-volume bar. Volume for that week was about double from the week prior.
Markets tend to go back to these areas for a test.
That area also represents a Fibonacci 38.2% retrace of the entire move off the February 2001, lows.
On top of that, a retrace to GLD 130, is a near exact -33% from the highs.
If that weren’t enough, price action getting to that level would automatically set-up a Wyckoff spring (reversal) condition by penetrating the support area shown.
Will this all happen? Obviously it’s unknown at this point. However, it does give us context.
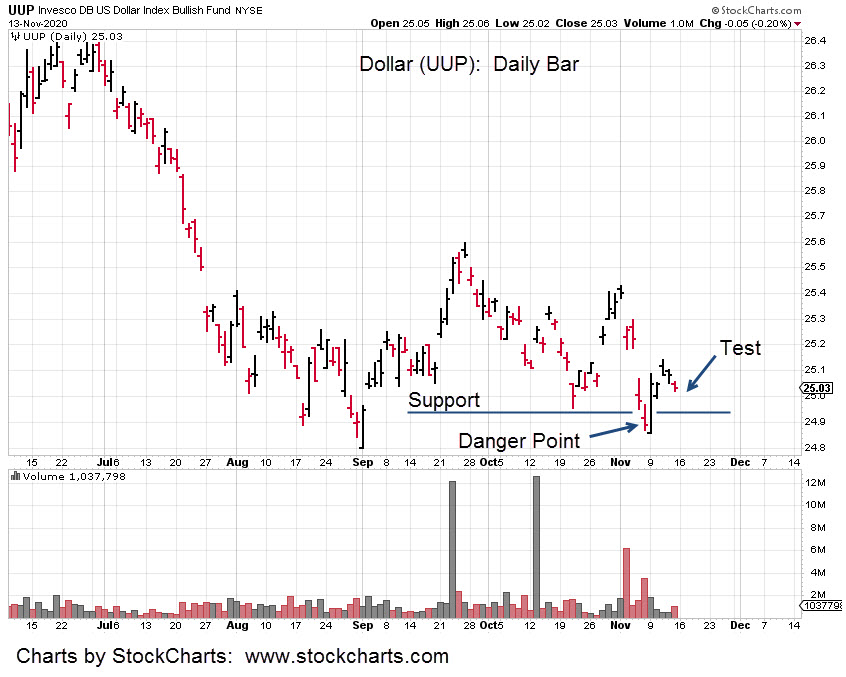
As always, price action is the final arbiter. We’re short on the GDX, the Major Miners via DUST (not advice, not a recommendation). Our original stop was probably too tight at just 0.41 points from entry.
We’ll see how it works out. Certainly, we are at another danger point.
Stay Tuned