Note: Posts on this site are for education purposes only. They provide one firm’s insight on the markets. Not investment advice. See additional disclaimer here.
Note: Posts on this site are for education purposes only. They provide one firm’s insight on the markets. Not investment advice. See additional disclaimer here.
Do we have a ‘one-off’ event or is the data point being repeated?
To help answer, this site’s been monitoring what should be one of the fastest selling (used) cars in the market, Toyota Camry.
Scanning the CarMax inventory of Camry’s has the same cars (with minor changes) still for sale, since August, at elevated prices no -less.
Seems to corroborate the link above and makes you wonder what’s (really) happening?
With that, let’s move on to the potential opportunity.
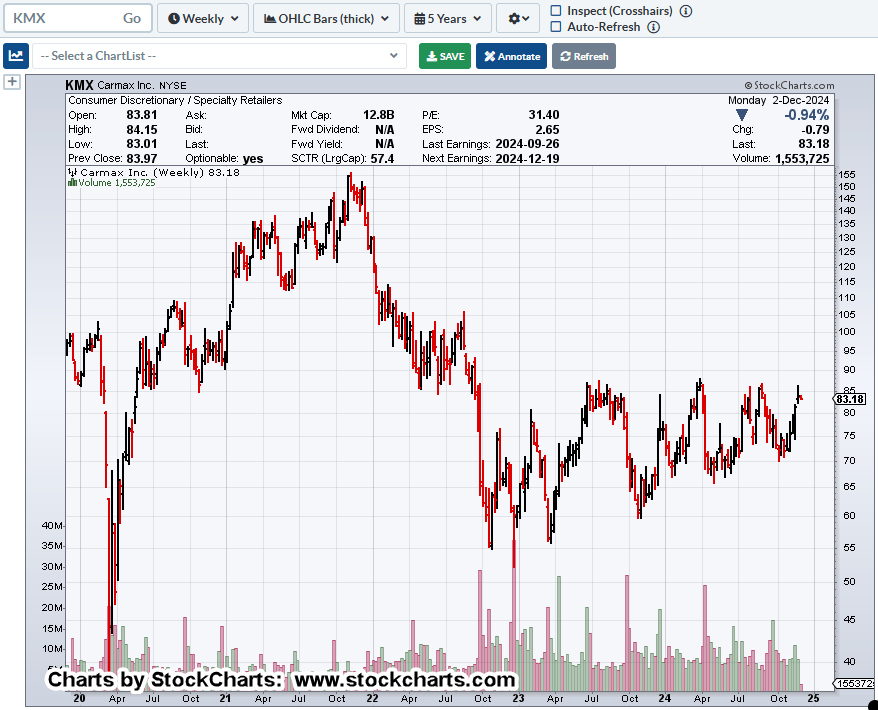
CarMax KMX, Weekly
There’s a lot going on in this chart.”
“What do you see?”
The wedge is obvious.
Maybe a little more subtle until it’s pointed out, huge volume churn since the breakdown during the week of September 30th, 2022.
That’s over two-years of potential distribution.
From a Wyckoff standpoint using his ‘Cause and Effect’ analogy, whatever’s about to happen to KMX, it’s setting itself up for a potential, sustained, long-duration move (not advice, not a recommendation).
Earnings Release
Earnings scheduled for December 19th, before the open.
Note: Posts on this site are for education purposes only. They provide one firm’s insight on the markets. Not investment advice. See additional disclaimer here.
Note: Posts on this site are for education purposes only. They provide one firm’s insight on the markets. Not investment advice. See additional disclaimer here.
The next trade (lower) could be in silver itself, or it could be in the Junior Miners, GDXJ, and/or SILJ, the sectors (ETFs) most susceptible (not advice, not a recommendation).
The last time silver had a major downswing was in early-to-late 2022; tracking fund SLV, declined about -35%, top-to-bottom.
During the same period, Junior Miners GDXJ, declined over -50%, so take your pick.
Silver SLV, closed out last week penetrating downside support and then moving (inching) back higher.
We should all know what that means. 🙂
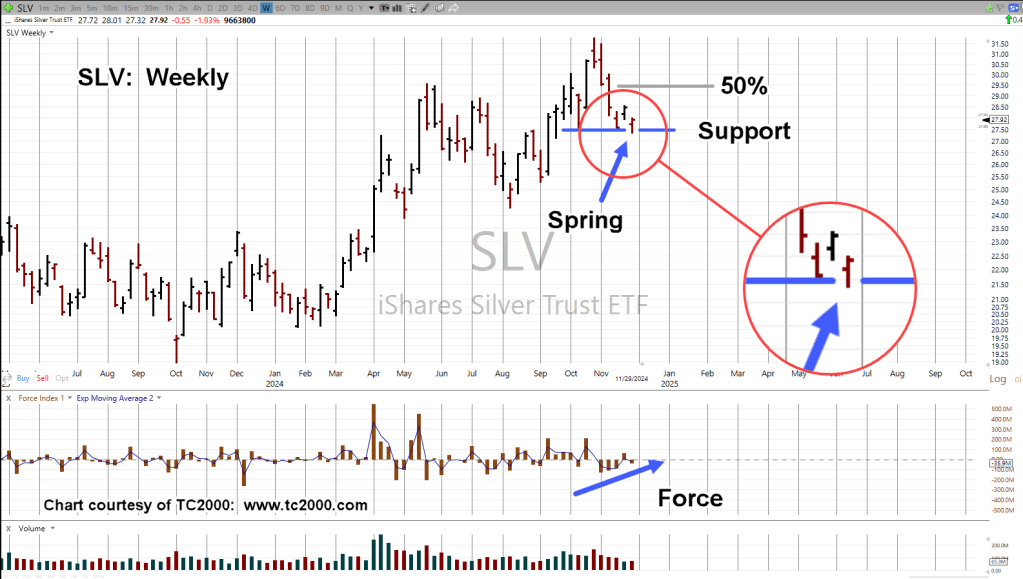
Silver SLV, Weekly
Silver penetrates support and then retraces; Wyckoff ‘spring’ position (not advice, not a recommendation).
The 50% retrace area is shown. It will be interesting to see if SLV, gets that far.
Perhaps more interesting from a set-up standpoint, is what GDXJ, and SILJ, will be doing if and when that happens.
Positioning: SLV & Miners
The mining sector has been ‘out-of-favor’ since this update years ago.
Since that time and looking at the charts, the most dynamic (fastest action) trade opportunities, were to the downside.
There are no open positions in this sector at this time (not advice, not a recommendation).
Positioning: Biotech, XBI-24-01
Separately, as stated in this update, the short trade in biotech (via XBI) was brief.
It was stopped out with a loss of 0.15-pts (not advice, not a recommendation).
Note: Posts on this site are for education purposes only. They provide one firm’s insight on the markets. Not investment advice. See additional disclaimer here.
Note: Posts on this site are for education purposes only. They provide one firm’s insight on the markets. Not investment advice. See additional disclaimer here.
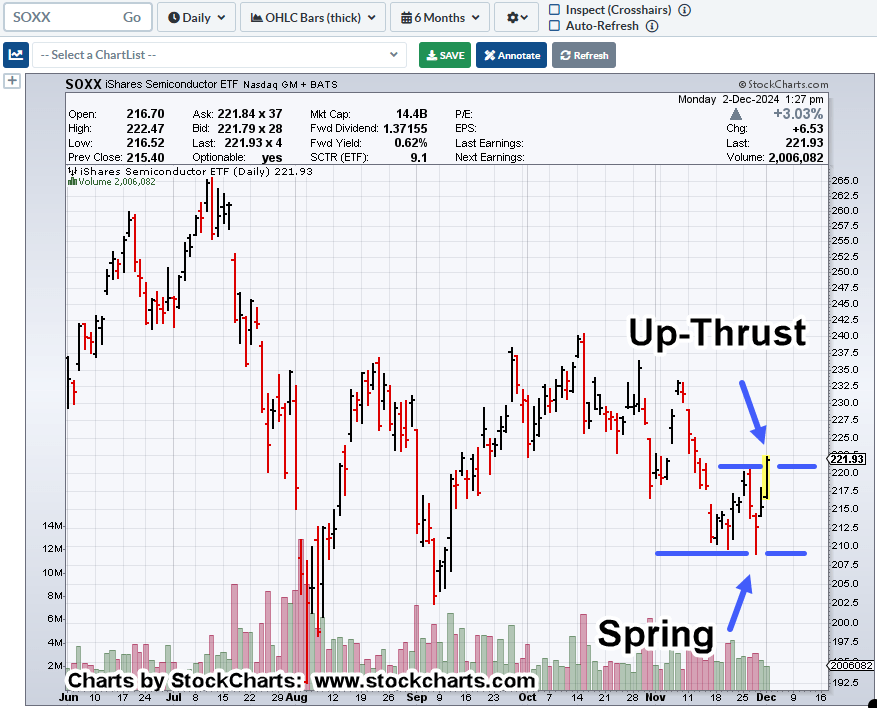
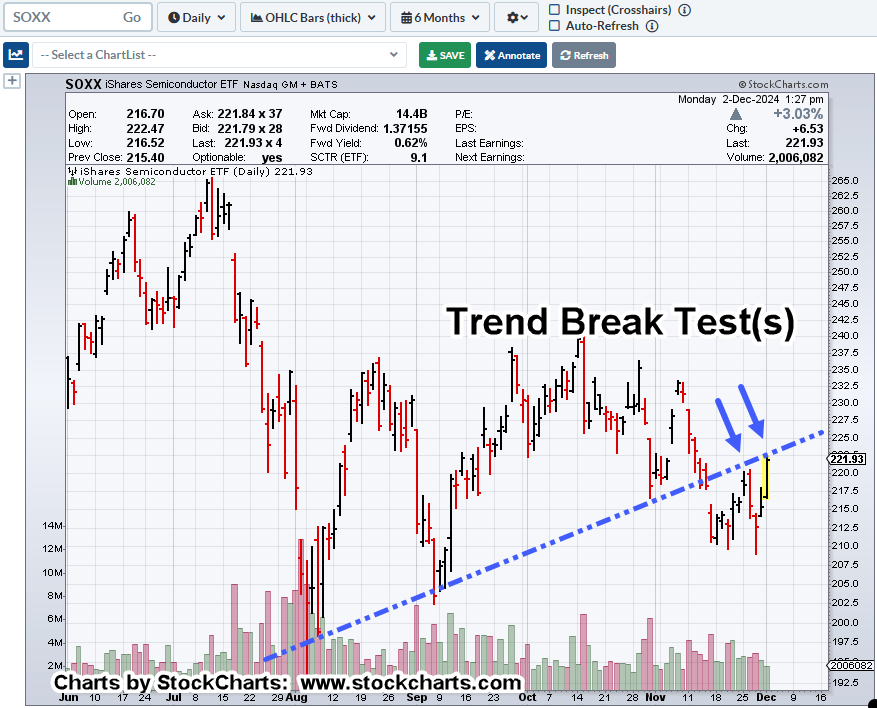
Watching the SOXX, price action in real time, is like a slow-motion train wreck.
The trendline shown below, was broken two weeks ago.
Since then, we’ve had an upside test.
As of the close today, that test appears to be complete (not advice, not a recommendation).
Semiconductors SOXX, Weekly
Frist, the break and test.
Next, we’re at Fibonacci Week 21, from the all-time highs and reversal.
All of this suggests some type of inflection point.
Positioning
As of today’s close, the original entry (SOXS @ 19.98) for SOXS-24-20, is up a solid +17.67%.
Since that entry, other smaller trades (eight in total) have been profitable, thereby reducing the price-level, increasing the gain, of the original entry (not advice, not a recommendation).
We may be at the point, where that ‘slow-motion train wreck’, begins to pick up steam.
Note: Posts on this site are for education purposes only. They provide one firm’s insight on the markets. Not investment advice. See additional disclaimer here.
Wasn’t silver supposed to ‘catch up’ with gold and ‘close the gap’, launch higher because of ‘hyperinflation’, ‘go along for the ride’, expose the ‘evil manipulators’?
No one ever considered that gold might head lower, to close that gap, but I digress (not advice, not a recommendation).
Of course, we won’t know until it’s all over if this is just a blip lower or if we’re in a sustained downside reversal.
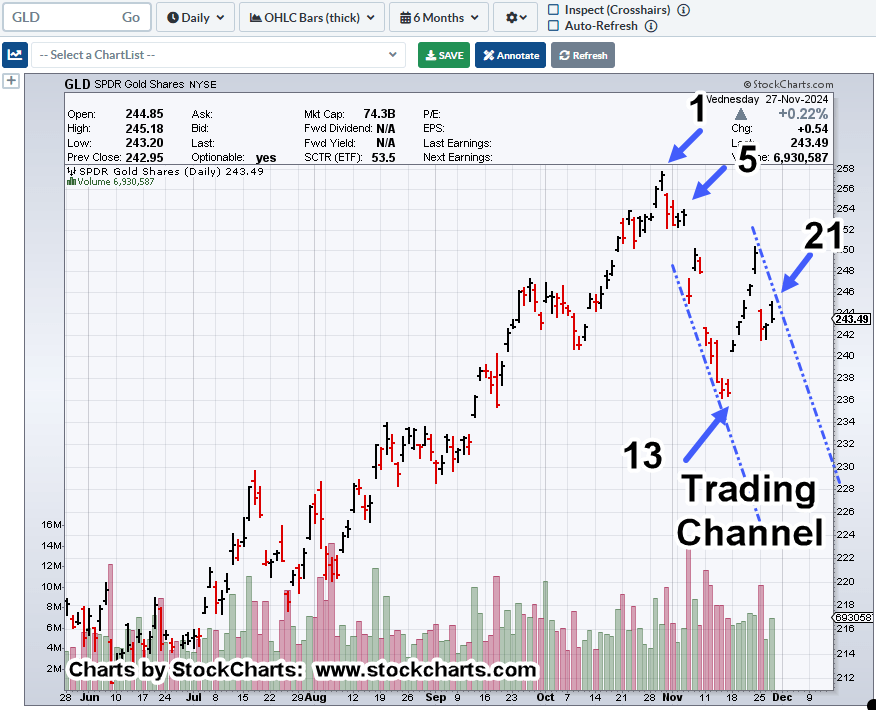
One thing that is known from the chart itself, we have Fibonacci showing up yet again.
Gold GLD, Daily
First, the un-marked chart. “What do you see?”
Now, for the mark-up. This is one way to look at it.
Wednesday’s close was slightly higher and with increased volume.
That suggests some amount of support … or behind Door No. 2, a potential exhaustion point if support fails.
Currently (as of 9:18 a.m., EST), in the futures market gold (GCG25), is up about +0.24%.
Note: Posts on this site are for education purposes only. They provide one firm’s insight on the markets. Not investment advice. See additional disclaimer here.
Strange things happen in the markets just before, during, or just after a holiday week.
This time is no different.
With all that’s gone on in the past few weeks, one gets a sense ‘the jig is up’.
One example of the curtain being pulled back on a well-established grift, is this unrelated, but related post, link here.
So, it could be with biotech.
The past two weeks look like a change of character (not advice, not a recommendation).
Biotech XBI, Daily
It’s been a Fibonacci 13-Days since the reversal on 11/11.
The sector has accelerated to the downside on record volume and now, is testing that break.
The ‘Axis Line’, is also the location of the 61.8%, retrace for the current down-move and test.
Although there’s been no new daily low to ‘confirm’ the test is complete, (upside) risk may be at a low.
Positioning
For reasons to be covered in a later update, this sector’s being shorted directly as opposed to using leveraged inverse LABD (not advice, not a recommendation).
Trade is labeled: XBI-24-01
Stop level for the short is (or will be) the session high, currently at XBI 99.79 (not advice, not a recommendation).
Note: Posts on this site are for education purposes only. They provide one firm’s insight on the markets. Not investment advice. See additional disclaimer here.
The next down-leg in the SOXX, and A.I., bubble, may be at hand (not advice, not a recommendation).
Many factors coming together; Fibonacci projections, retrace levels and time sequences; price action posting and defining trend lines and trading channels.
With that, let’s take a look at what the SOXX, is saying about itself.
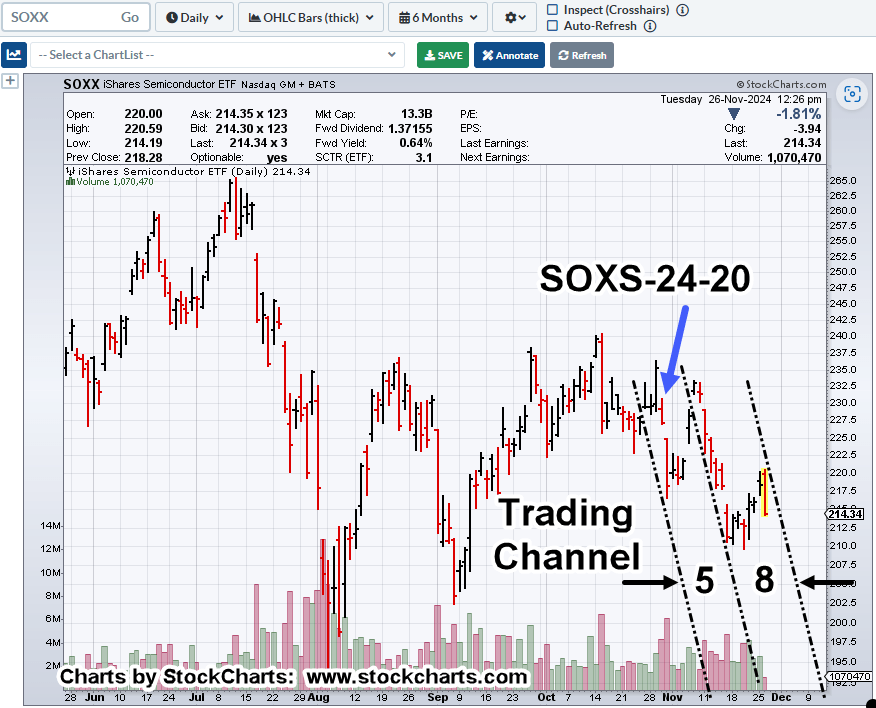
Semiconductors SOXX, Daily
We’re half-way though today’s session, anything can happen. Even so, the test and reversal are clear.
What also may be in the making, is the verification of the trading channel shown.
The channel has its own Fibonacci count(s).
One part, Fibonacci 5-days wide, another, Fibonacci 8 days, for a total of Fibonacci 13-days.
Positioning
For those following this site on a daily basis, you already know, this sector’s been sold (short) via leveraged inverse fund SOXS (not advice, not a recommendation).
Trade number is, SOXS-24-20, in the sidebar, above.
The short was initiated with this update, shown above in the chart. It was maintained throughout the gyrations of the ‘election’ and aftermath.
Now, we wait.
If nothing else, and the trade falls apart, today’s session high in the SOXX, is an excellent place for a stop (not advice, not a recommendation).
Note: Posts on this site are for education purposes only. They provide one firm’s insight on the markets. Not investment advice. See additional disclaimer here.