That’s two times in a row, Carvana hit a target area (presented on this site) in the after-hours session.
The last time was here, CVNA printed 310, in the after-hours on February 19th.
Then, just hours ago, price action thrust higher into the zone in this post, printed at 243.6, then collapsed.
We never got to ‘Day 34’.
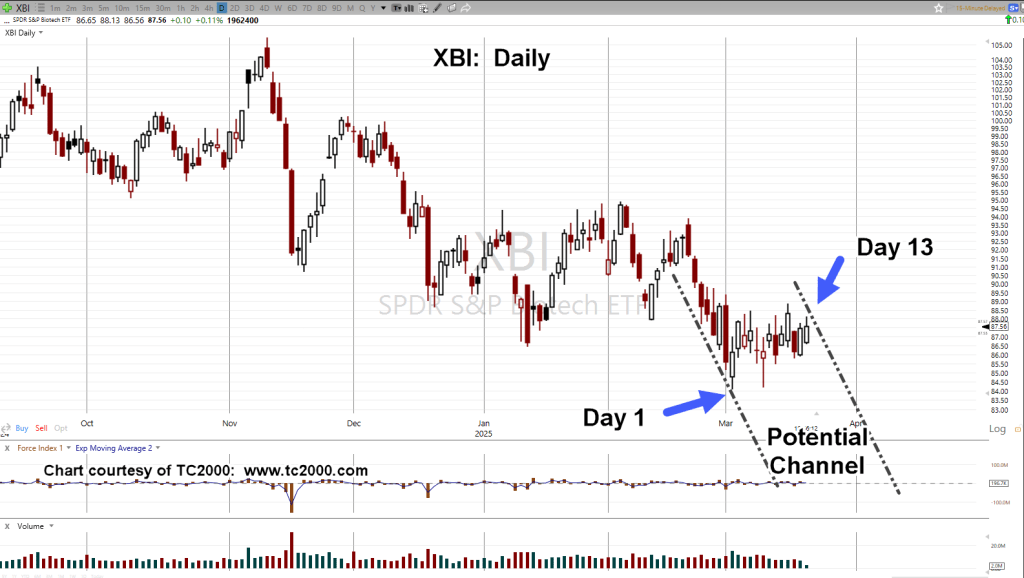
However, the real story may be in biotech XBI, with huge swings in both directions; currently (as of 6:35 p.m., EST) trading below today’s regular session low.
Note: Posts on this site are for education purposes only. They provide one firm’s insight on the markets. Not investment advice. See additional disclaimer here.
Even as price reached its after-hours high of 310, on February 19th, and posted down ever since, short interest continues to decline.
As BigCharts reports, short-interest is now at 6.5%.
First, it was 33% short, then it dropped to 10%, then 7.8%, and now 6.5%, all the while, it looks like we’ve passed the top (not advice, not a recommendation).
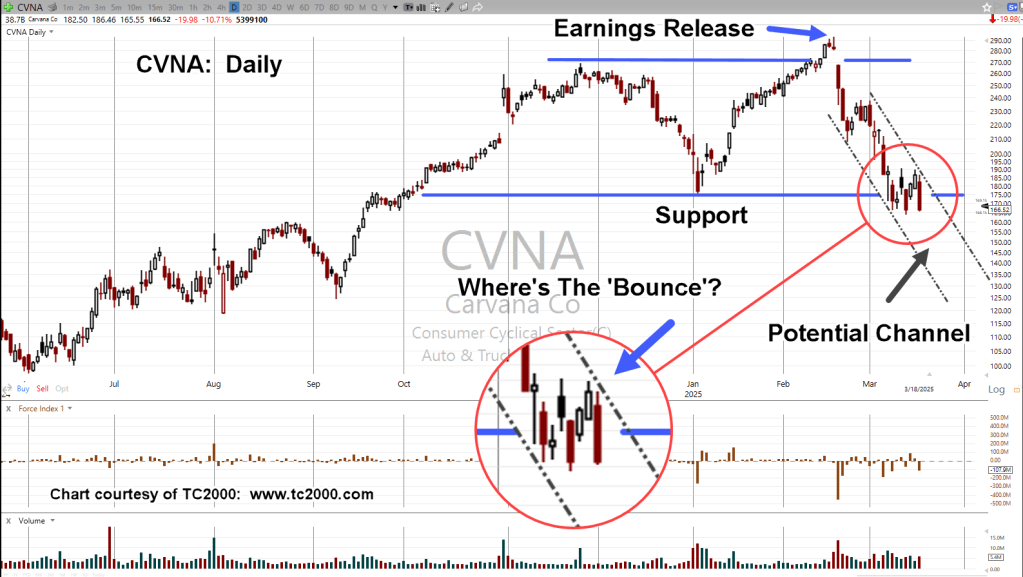
The last update showed a trading channel that has since been negated. So, what’s price action doing now?
Carvana CVNA, Daily
As of this post (10:47 a.m., EST) price action has yet to define another channel … if there is one.
What we do have, is a Fibonacci time sequence in effect thus far.
At this juncture, we’re far away from the magenta (target) oval and Fibonacci Day 34.
However, as outlined by Car Questions Answered, this time of the year, typically has tax refund purchasing.
Note: Posts on this site are for education purposes only. They provide one firm’s insight on the markets. Not investment advice. See additional disclaimer here.
Note: Posts on this site are for education purposes only. They provide one firm’s insight on the markets. Not investment advice. See additional disclaimer here.
Note: Posts on this site are for education purposes only. They provide one firm’s insight on the markets. Not investment advice. See additional disclaimer here.
Note: Posts on this site are for education purposes only. They provide one firm’s insight on the markets. Not investment advice. See additional disclaimer here.
Yesterday’s mid-session update said Carvana’s posting a repeating pattern.
That pattern is what’s called a Wyckoff ‘spring-to-up-thrust’.
Even before, yesterday, this update said we’re expecting some kind of bounce.
Well, we got it; then, price action went on to post a potential reversal (not advice, not a recommendation).
Today’s session may or may not contain a ‘test’ of that (reversal) action.
Let’s go to the chart.
Carvana CVNA, Daily
There’s a lot going on.
As the chart notes, when taking the retrace measurement from the after-hours high of 310, posted during the earnings release, yesterday’s action topped out right at the Fibonacci 23.6%, level.
We’re about twenty-minutes before the regular session; CVNA, is trading lower by 3.6-pts.
Note: Posts on this site are for education purposes only. They provide one firm’s insight on the markets. Not investment advice. See additional disclaimer here.
Note: Posts on this site are for education purposes only. They provide one firm’s insight on the markets. Not investment advice. See additional disclaimer here.
Corporate Insiders Scramble To Buy Their Own Stock As Buyback Blackout Period Begins. Link here.
Last but not least, my personal favorite 🙂
Recession Canceled: US Industrial Production Jumps To Record High. Link here.
David Weis 1980s
Back in the 1980s, the late David Weis was a bond trader.
He published a series of trading articles using Wyckoff analysis; in one of those, this comment stood out (paraphrasing):
‘We considered none of these things …’
That is, stay focused on what the market is saying about itself. Ignore the press and any other distractions.
With that, we have Carvana.
Carvana CVNA, Daily
What can be said?
After penetrating support, some kind of bounce is expected … except, so far, it’s not happening.
This post is coming out before the regular open.
CVNA is trading a couple points higher (pre-market) but nowhere near the nearest 189-ish, resistance area.
The Fed has yet to announce their shenanigans for the day; that itself, could cause a bounce higher … or not.
While the press chases after squirrels and gold, the market itself (CVNA) is saying, if it can’t retrace higher but pivots down, it indicates significant weakness (not advice, not a recommendation).
Note: Posts on this site are for education purposes only. They provide one firm’s insight on the markets. Not investment advice. See additional disclaimer here.
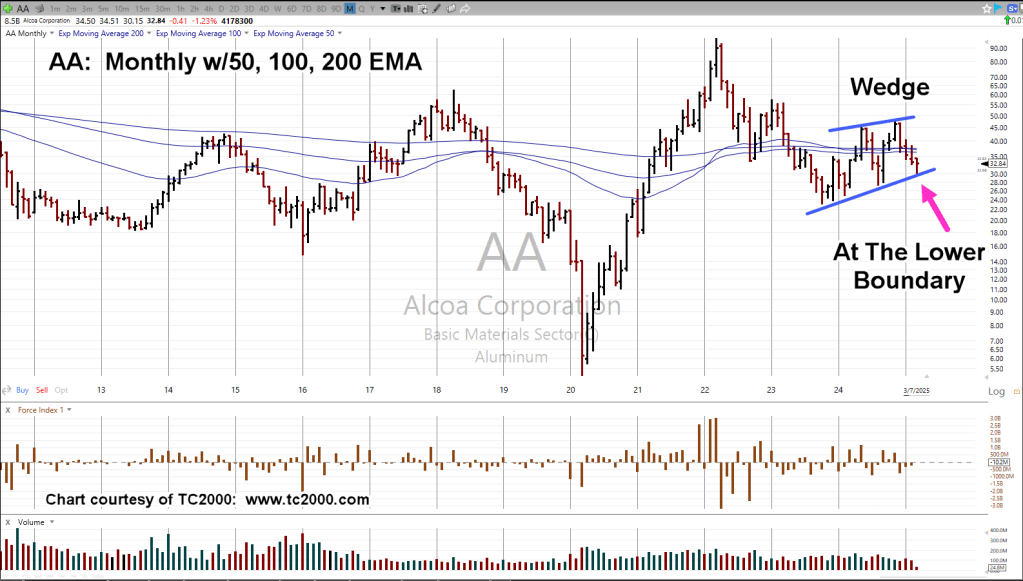
Yesterday, biotech had moving average compression; today, it’s Alcoa.
In this case, we’ll present the monthly chart, showing the long-term picture.
As we’ll see, moving average compression is rare, especially when using the longer time-frames.
In the case of Alcoa (AA), you have to go all the way back to 1978, to find a similar event.
The Big Bubble
Referring to Prechter’s analysis link here, he states that we’re [potentially], in the largest asset bubble since the South Sea, over 300-years ago.
Let’s keep that in mind. Events are happening on such a massive scale; the typical observer may not be aware of the significance and/or the rarity.
Alcoa AA, Monthly
The zoom areas are side-by-side to show the similarity.
Expanding the chart and including the wedge notation, also shows price action at the lower boundary.
It should be noted, AA, is part of the ‘Basic Materials’ sector, with tracking ETF as IYM.
Included in the IYM components, is NEM, and RGLD; this sector is correlated with the miners, GDX, GDXJ.
Positioning
It’s the trader’s discretion as what to do at this point.
This site may or may not execute a direct short of Alcoa, just as it might do with Carvana (CVNA), and maybe others (not advice, not a recommendation).
Note: Posts on this site are for education purposes only. They provide one firm’s insight on the markets. Not investment advice. See additional disclaimer here.
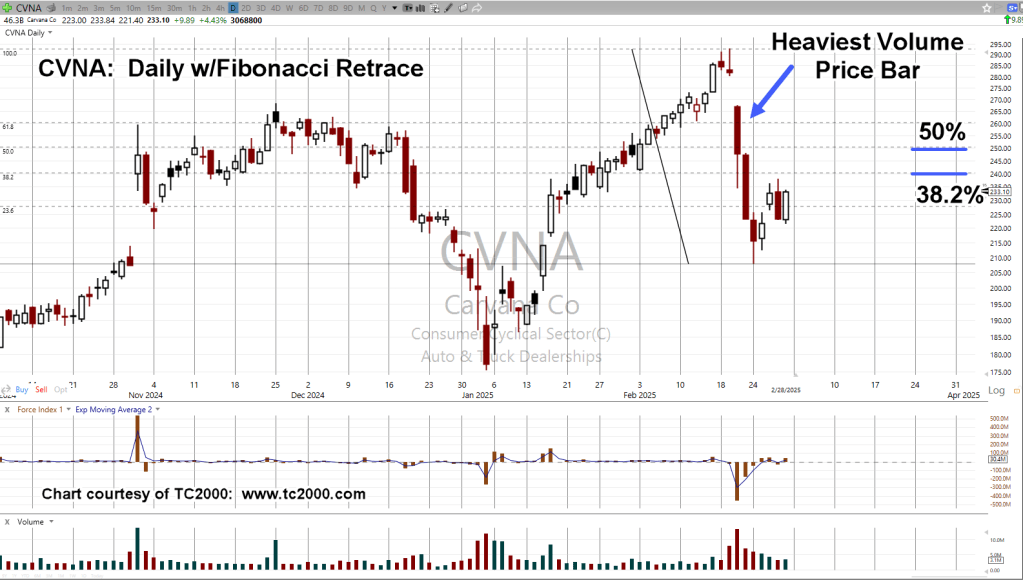
February 19th, after hours action, Carvana posted 310 as the high; then, three days later, the lows at 207.85:
That’s a direct hit of -33%
Then, incredibly, short interest does not increase but decreases (from just over 10%) to 7.8%; you can’t make this up.
Emotionally Exhausted:
If you’d been short this (vending machine) ‘disruptor’ for nigh on two years, as it rachets ever higher, and then it finally, breaks down … what would you do?
You’d probably be emotionally (maybe financially) exhausted, tired of watching the never-ending grind higher and cover (whatever’s left of) your shorts.
Wheels Off
As Hindenburg reports, Carvana has some interesting ‘fundamentals’.
With that, let’s look at the most likely area for a possible punch-drunk recovery top, and reversal (not advice, not a recommendation).
Carvana CVNA, Daily
The price bar with the heaviest volume was the day after the earnings release as shown.
That bar’s close is right around the 50% retrace.
However, if we extend the top of the retrace tool to start at the after-hours 310, mark (and not regular session high of 292.84), the 50% retrace now becomes the 38.2%.
Note: Posts on this site are for education purposes only. They provide one firm’s insight on the markets. Not investment advice. See additional disclaimer here.