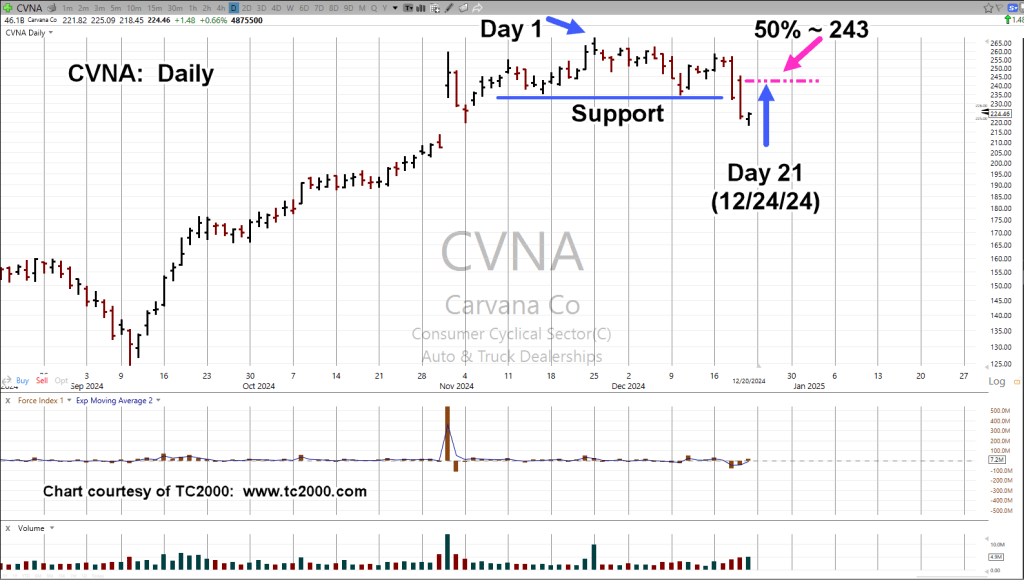
The last update on Carvana, link here, identified the potential for downside reversal.
That’s what we got 🙂
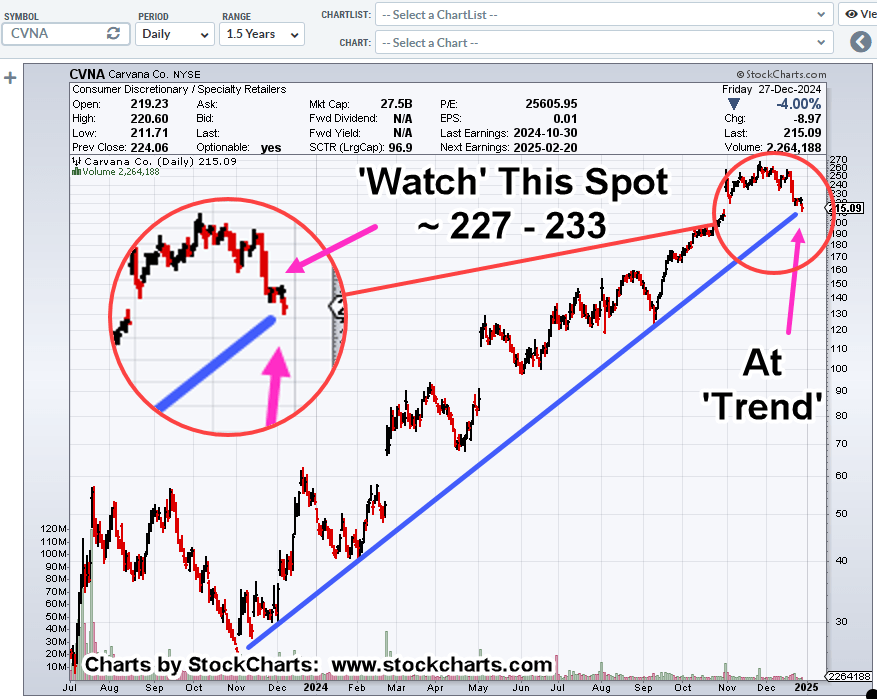
Now, as we’ll see in the chart below, CVNA is right at the trendline.
Carvana CVNA, Daily
We’re at the trend, but there’s a slight possibility price action will rebound (off the trendline) to the area noted (not advice, not a recommendation).
Let’s add this insight from Greg Hunter and Ed Dowd, concerning the economy, link here.
After watching the interview, judge for yourself whether or not we have recovery higher first, or we head lower, first.
Note: Posts on this site are for education purposes only. They provide one firm’s insight on the markets. Not investment advice. See additional disclaimer here.
Note: Posts on this site are for education purposes only. They provide one firm’s insight on the markets. Not investment advice. See additional disclaimer here.
Note: Posts on this site are for education purposes only. They provide one firm’s insight on the markets. Not investment advice. See additional disclaimer here.
As of Friday’s close, Carvana boasts a P/E, of 30,876.
Meanwhile, Carvana’s nearest competitor CarMax, has a P/E of 31.79, which in itself, is a bit sporty.
Caravana’s sales are less than half that of CarMax, yet its market cap is over three-times larger (source, www.tc2000.com)
Carvana’s ‘vending machine’ disruptive technology looks like it’s ‘worth’ an extra 97,000%, added to its P/E valuation (obviously, not advice, not a recommendation).
At the end of October, was this post, indicating Carvana may be in its final squeeze.
Since then, Carvana has inched itself higher.
Carvana CVNA, Daily Close
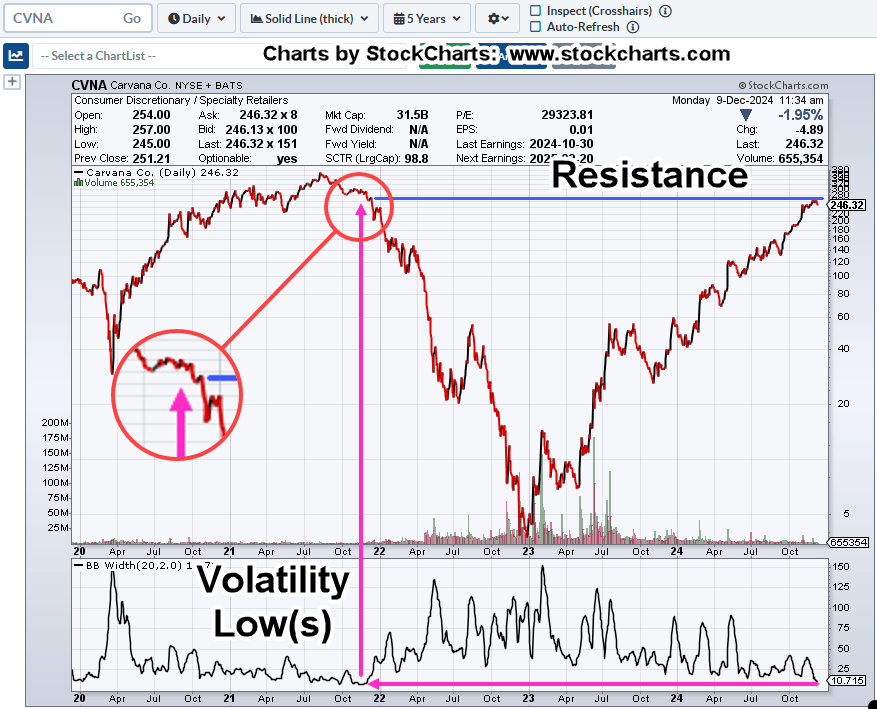
The two charts show that demand as measured by volume (spikes) has diminished significantly.
Moving in closer, we’ll look at a potential up-thrust set-up.
If we have just seen (or are in) the final thrust higher, the expectation is for price action to reverse down, then test the underside of resistance (not advice, not a recommendation).
Carvana’s earnings release is not until February next year, but CarMax, that’s a different story.
CarMax is set to post earnings on December 19th (or 20th), this year, during market hours.
Note: Posts on this site are for education purposes only. They provide one firm’s insight on the markets. Not investment advice. See additional disclaimer here.
Short interest on Carvana, has been holding at a stubborn 12% – 13%, for what seems like months.
As of this post, BigCharts reports current short-interest at 11.67%.
Maybe that’s about to change with today’s gap-higher action (not advice, not a recommendation).
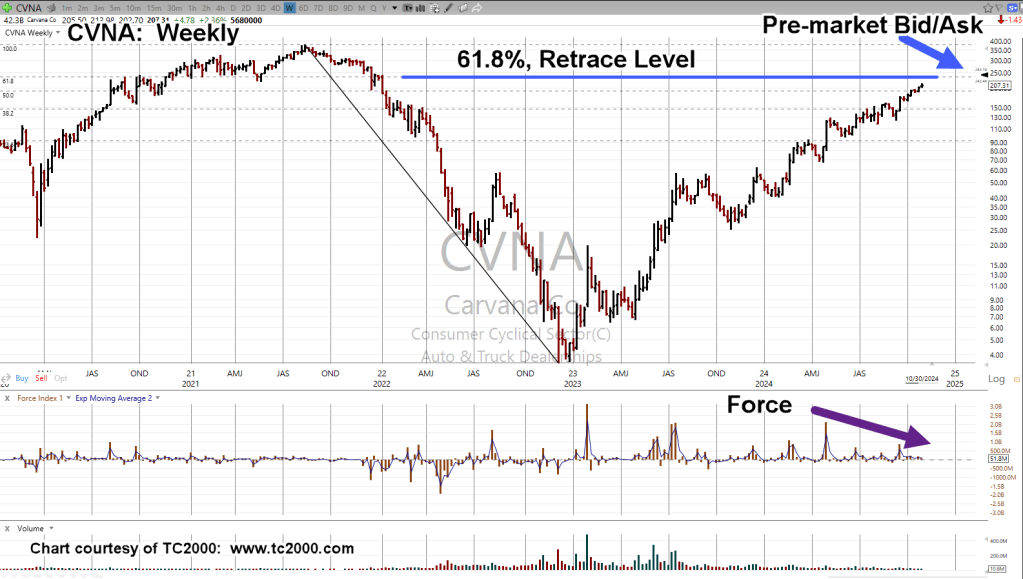
Carvana just released earnings and like the analysis of Taiwan Semi (link, here), this may be the end of the squeeze (or, the beginning of the end).
Carvana CVNA, Weekly
Pre-market action’s right at the 61.8%, retrace level.
Note the magenta arrow on Force Index, middle panel.
Subsequent upward thrusts have less and less energy.
Other Markets: SOXX
We’re about twenty-minutes before the open and Semiconductors, SOXX, looks like it will confirm the downside reversal (not advice, not a recommendation).
Note: Posts on this site are for education purposes only. They provide one firm’s insight on the markets. Not investment advice. See additional disclaimer here.
Anyone with two piston-rings rubbing together knows, the car industry is in chaos if not full-blown collapse, links here, here, and here.
We also ‘know’ that Carvana’s financial results have reached the realm of ‘interesting‘.
The last update on Carvana proposed that price action might continue on to a 50% retrace.
So far, it’s not happening.
In fact, it looks like CVNA, has decided to roll-over.
Carvana CVNA, Weekly
Price action has formed a terminating wedge, currently testing the bottom … potentially near a breakout to the downside (not advice, not a recommendation).
It’s about ten minutes after the open; CVNA is trading down 2.14-pts @ 128.58, hovering around the bottom wedge line.
Because CVNA, has such an ‘interesting’ business model, if and when we get a surprise, price action could move faster than anyone thought possible (not advice, not a recommendation).
Note: Posts on this site are for education purposes only. They provide one firm’s insight on the markets. Not investment advice. See additional disclaimer here.
Note: Posts on this site are for education purposes only. They provide one firm’s insight on the markets. Not investment advice. See additional disclaimer here.
Question: Who’s going to buy from Carvana, knowing they’re clearing over $7,000 profit on every sale?
The latest earnings release states they’re making Gross Proft per Unit, of $7,049, vs. a more reasonable $529, from just one year ago; that’s over 1,200% increase!
Months ago, after the last CVNA earnings release, the father/son team of CarEdge found the operating numbers to be very curious.
Carvana CVNA, Daily
Price action is at a new high, and hesitating (not advice, not a recommendation).
Volume for the day (thirty minutes before close) has increased.
MACD is posting a bearish divergence and price action appears to be holding right at resistance (blue line).
All of which indicates, we may be at The Danger Point®.
Note: Posts on this site are for education purposes only. They provide one firm’s insight on the markets. Not investment advice. See additional disclaimer here.
Right along with the current narrative, ‘The Fed’s going to cut rates’, is another narrative, ‘The Fed’s in charge, a leader, and sets rates’.
Is either one, actually true?
Years ago, Robert Prechter Jr. pointed out very convincingly, the Fed’s a follower, not a leader.
His research showed, over many years, the Fed consistently follows the market.
Along with that, was his premise, ‘The market leads the news, not the other way around’.
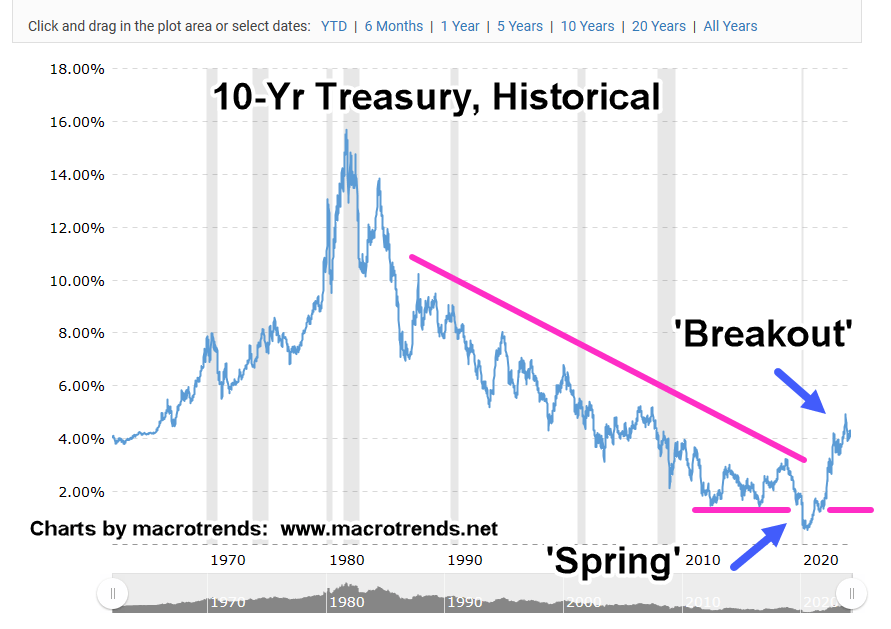
Using that, we’ll look at what the Fed’s likely to do next; let’s use the long-term view, the 10-Year Treasury.
What’s it telling us?
Macrotrends Historical Chart: Ten Year Treasury
As posted in the prior update, the 40-yr bond bull market, i.e., lower rates, is over (not advice, not a recommendation).
We see the upside reversal in rates (downside for bonds) took over 10-years to set up.
Rates pushed below established support into a Wyckoff spring condition, then reversed higher, then into an outright breakout.
Currently, we’re hovering around in ‘no-man’s land’.
Could rates dip lower (bonds higher) and we get a token rate cut in response from the Fed?
Well, as David Weis used to say, ‘Anything can happen’.
Strategy First
However, from a strategic standpoint and for the long-term, higher rates are more probable.
The market has already responded with interest rate sensitive sectors and stocks (IYR, KMX, CVNA, etc.), having peaked long ago, in 2021.
A Dangerous Game
Depending on one’s perspective, what’s going on here with interest rates, is a dangerous game of ‘chicken’.
As Uneducated Economist puts it, the Fed’s a ‘credible threat’; all they have to do is ‘talk’ and propose (i.e., threaten) to move rates and the market responds without the Fed actually doing anything.
It’s working, for now.
The Emperor Has No Clothes
The problem is, as Prechter has already shown with research done years ago, ‘the emperor has no clothes’.
The Fed does not control rates at all; it’s a follower, only doing what the bond market’s telling it to do.
For some reading this, it’s old news.
For others, it’s a shock to find out, yet another institution is not what you thought it was.
Note: Posts on this site are for education purposes only. They provide one firm’s insight on the markets. Not investment advice. See additional disclaimer here.
The last update on Carvana (CVNA), asked the question if price action would enter what’s likely stop-loss territory for the shorts.
Well, here we are.
Just before the October post, CVNA restructured debt, but it was not yet in the numbers.
The result now, (via TC2000), is an improved book value of $2.13/share, with debt to total capitalization of just 97% … Wow, I feel much better 🙂
But wait, there’s more.
CVNA just posted ‘interesting’ numbers on its latest earnings. For discussion on that wonderment, link here.
All of which brings us to the chart.
Carvana CVNA, Weekly
The original (blue) resistance line and potential retrace target (23.6%) from the October ’23, post is re-created in the updated chart.
For the original post, the expectation was, shorts would be covered as CVNA broke out into the target zone.
Well, we have the breakout, but according to BigCharts (www.bigcharts.com), only about 150,000 shares of the over 33 million (sold-short) have been covered; not exactly the short-covering pandemonium that was expected.
At the same time, let’s not forget, sales at the new car dealers have already collapsed, link here.
The used car market is not much different, link here.
It may be the ‘big-shorts’ are just going to wait it out.
It may not take long (to reverse) under current conditions (not advice, not a recommendation).
Note: Posts on this site are for education purposes only. They provide one firm’s insight on the markets. Not investment advice. See additional disclaimer here.