Note: Posts on this site are for education purposes only. They provide one firm’s insight on the markets. Not investment advice. See additional disclaimer here.
Note: Posts on this site are for education purposes only. They provide one firm’s insight on the markets. Not investment advice. See additional disclaimer here.
Rates are not going lower, they’re going higher; sooner rather than later (not advice, not a recommendation).
Yesterday, ZeroHedge reported the 5-yr auction was nasty with rates rising to near recent highs.
Today, we have yet another supply disruption impacting so-called ‘inflation’.
Couple that with an apparent real estate implosion.
DH Horton (DHI) down nearly – 12% in just days and holding steady in the pre-market session.
It looks like the bubble party is (finally) over.
Gold Miners To Catch Bid?
The miners are at another critical juncture.
The Juniors GDXJ, are up in the pre-market session (8:00 a.m., EST) and may be catching a flight-to-safety bid as parts of the markets top out and/or reverse.
That flight to safety may not last long as we’ll see below.
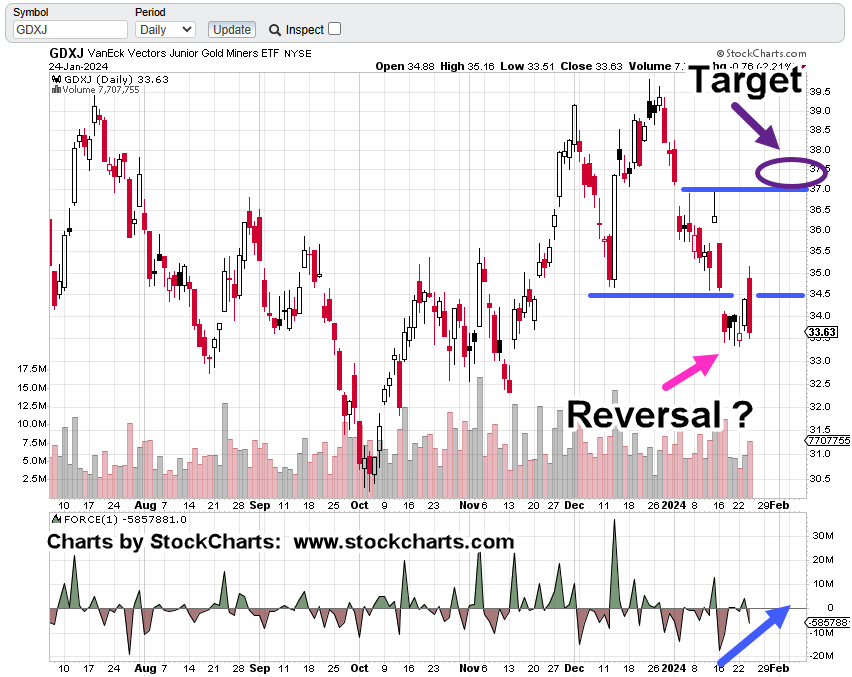
Junior Miners GDXJ, Daily
Trading is up about 1% or 0.32 pts in the pre-market.
GDXJ, price action is at The Danger Point®.
We are either in a reversal (Wyckoff spring) set-up or just a pause before posting lower.
If it’s a rally, the target area is shown (magenta oval); corresponding to a 61.8% retrace.
Note: Posts on this site are for education purposes only. They provide one firm’s insight on the markets. Not investment advice. See additional disclaimer here.
Note: Posts on this site are for education purposes only. They provide one firm’s insight on the markets. Not investment advice. See additional disclaimer here.
‘They [The Fed] are totally tricking the markets’ (time stamp 3:30), link here.
Yes, it’s a real chess game going on and the other side, makes up the rules.
This update presents that despite all the manipulation and head-fakes, significant market pivots in the miners were identified (correctly) with Wyckoff analysis.
That analysis, in turn, helped develop a long-term strategy (not advice, not a recommendation).
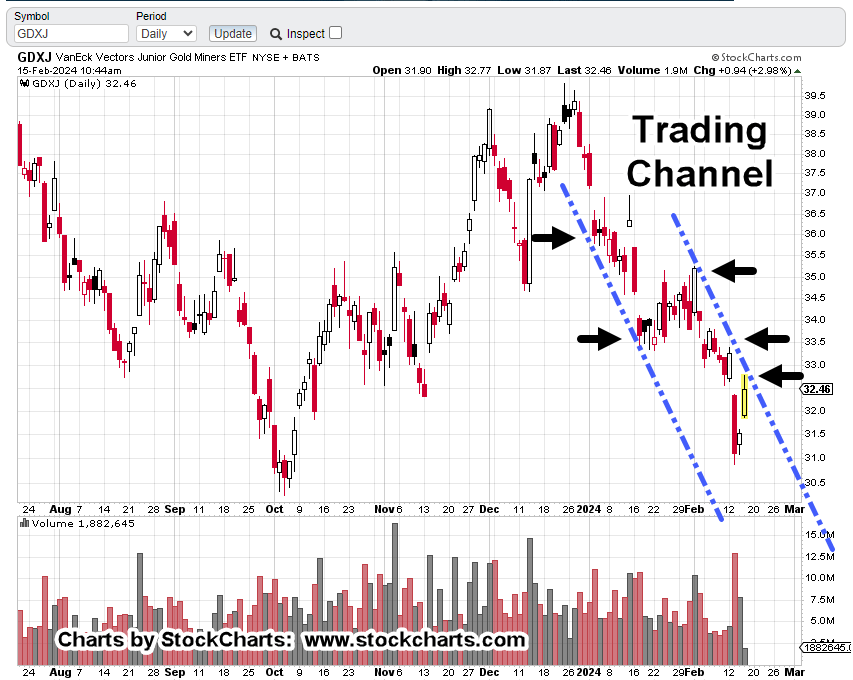
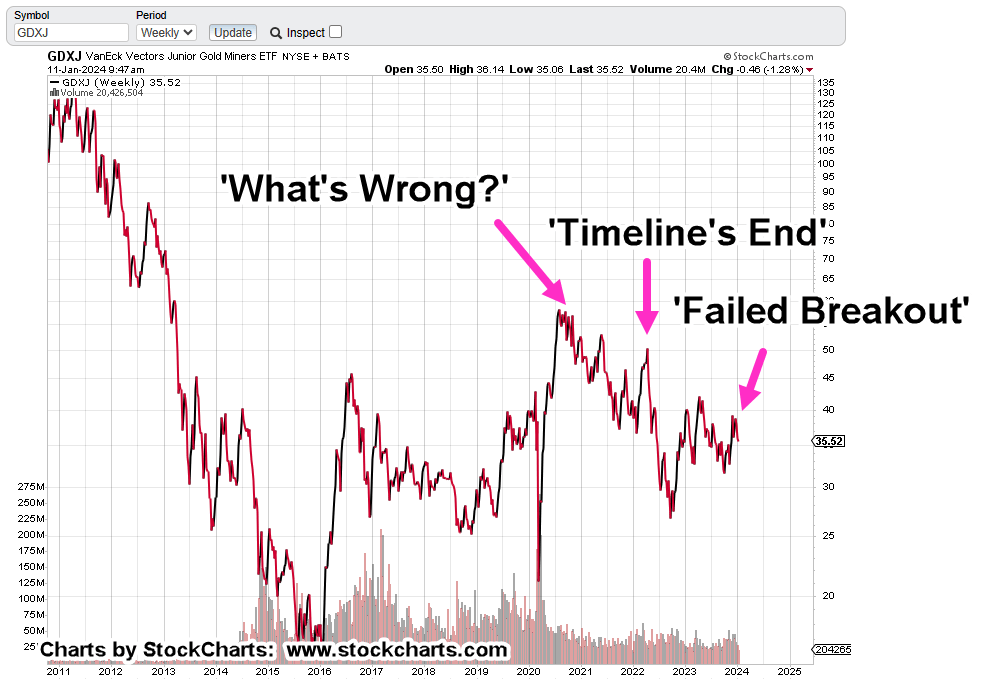
Junior Miners GDXJ, Weekly Close
Three key points are shown on the chart.
The first goes all the way back to October of 2020, link here. There’s something wrong with the miners.
Potential for another downward pivot, link here, was identified to-the-week, if not, to-the-day.
The subsequent move printed the most impulsive price action since the spike melt-down of early 2020.
Which brings us to today.
Another potential pivot has been identified, link here.
As of this post (11:20 a.m., EST) the Juniors GDXJ, continue to rachet lower.
The Long Term
As Ed Dowd points out in this interview, what’s happening now will affect us all for decades, if not centuries to come.
Therefore, it’s a good idea to have a long-term strategy.
From the above chart, it’s clear that Wyckoff analysis has been on the correct side of GDXJ price action; the bearish side (not advice, not a recommendation).
Note: Posts on this site are for education purposes only. They provide one firm’s insight on the markets. Not investment advice. See additional disclaimer here.
Note: Posts on this site are for education purposes only. They provide one firm’s insight on the markets. Not investment advice. See additional disclaimer here.
Note: Posts on this site are for education purposes only. They provide one firm’s insight on the markets. Not investment advice. See additional disclaimer here.
A military coup in Niger results in gold shipment suspension.
Correspondingly, the mining sector along with gold and silver, are higher.
The real question is, will gold, silver, and the miners continue upward or is this just an excuse to force out the weak (short-positioned) hands?
If we look at the facts, such as Niger’s gold output compared to the rest of the world, it’s miniscule; hardly a blip and production is decreasing.
Add in, the mining sector has not been in a bull market for years, and we’ll surmise, the current move higher has low probability of continuing (not advice, not a recommendation).
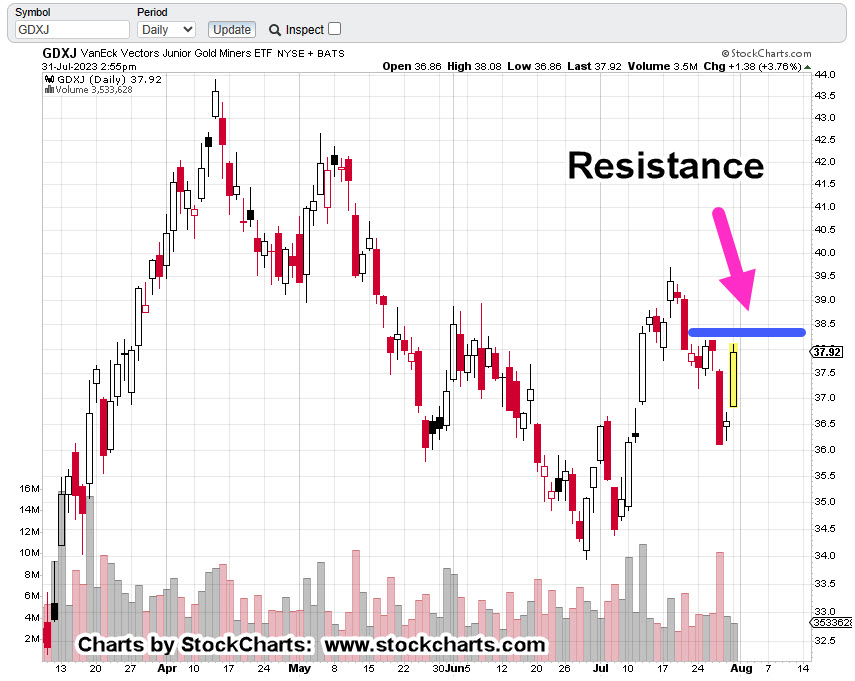
For today’s session (as of 3:11 p.m., EST), price action has effectively been slammed into resistance as shown.
Junior Gold Miners GDXJ, Daily
For positioning short (via JDST) this is potentially a low-risk area (not advice, not a recommendation).
There would need to be continued demand for a move higher past the resistance area (blue line).
Note: Posts on this site are for education purposes only. They provide one firm’s insight on the markets. Not investment advice. See additional disclaimer here.
‘Real (market) opportunities are rare. When one is found, it must be used to its fullest extent’; Gerald M. Loeb, the late, and former Vice Chairman, of E.F. Hutton
What a refreshing quote that is, back in the day when we had ‘Chairmen.’.
So, are the Miners the Juniors GDXJ, that opportunity?
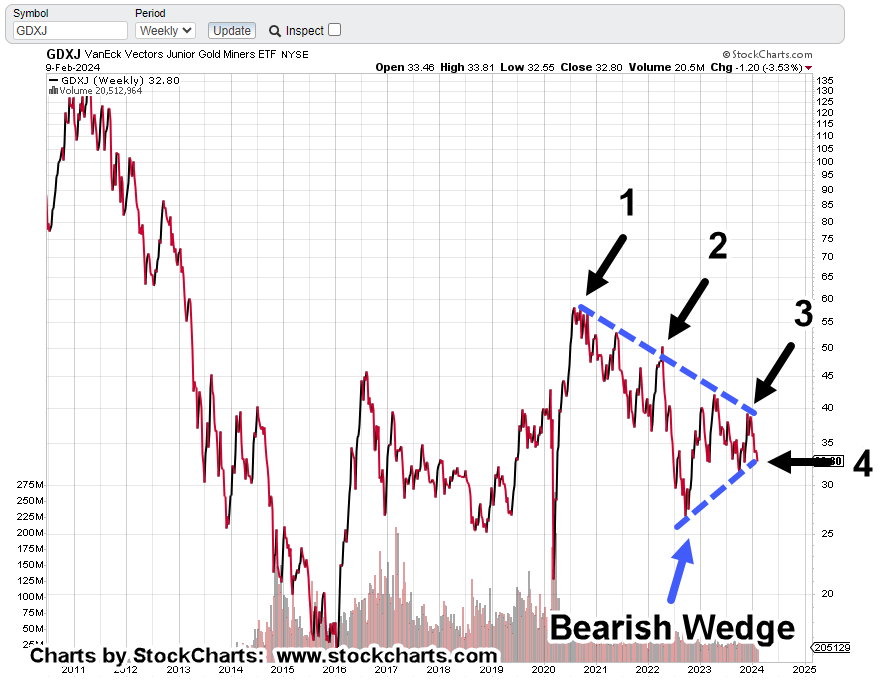
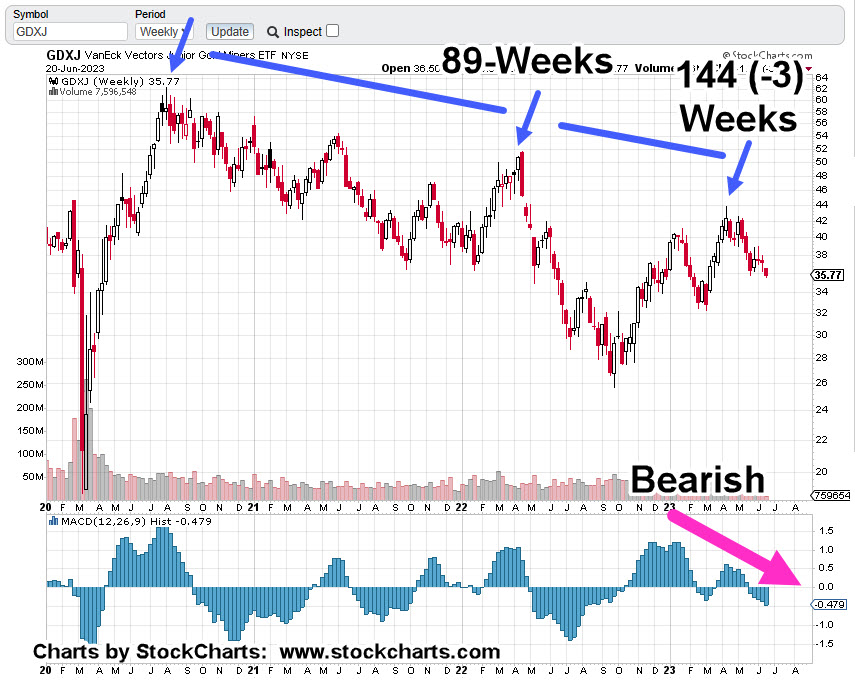
From a technical standpoint, there’s the bearish divergence on MACD when looking at the weekly. Then, we have Fibonacci correlation on the weekly as well (shown below).
The daily has the short entry signal given yesterday (not advice, not a recommendation).
Fundamentals Collapse
Next, we have industrial demand in collapse, not to mention the world economies. If industrial demand is collapsing for photovoltaic components (link here), then silver demand must be collapsing.
The ‘Gap’
The analysis was working fine in the pre-market for shorting the GDXJ (not advice, not a recommendation), but then at the open, there was the gap.
Let’s address that but first get started with the weekly chart of GDXJ
Junior Miners, GDXJ, Weekly
The technical details are clear: Bearish divergence on MACD as well as Fibonacci time correlation.
The original Fibonacci 89-weeks was covered in this post.
Yesterday, there was a gap-lower open and price action kept posting lower.
Will this gap be filled? That’s the question.
Junior Miners GDXJ, Daily
As the chart implies, was yesterday a breakaway gap?
Price action’s right at support … or slightly below, which technically put us in Wyckoff ‘spring’ position.
The ‘Probabilities’
Given the bearish overall condition of this sector both on a technical and fundamental basis, a gap-fill is unlikely … but one has to be prepared.
As stated in the last update, the short position via leveraged inverse JDST was increased (not advice, not a recommendation).
To account for possible gap closure on the inverse JDST, a soft stop (trader discretion) is at 6.80 and below, with an absolute hard stop (no excuses exit) at 6.38 (not advice, not a recommendation).
Note: Posts on this site are for education purposes only. They provide one firm’s insight on the markets. Not investment advice. See additional disclaimer here.
It’s rare to get a ‘textbook’ signal … but every now and then, it does happen.
The last update on the Junior Miners, GDXJ, said a short position in the sector was re-established.
Today’s trading action may be straightforward; we either get stopped-out, or the market gives the signal to enter a full (sized) position (not advice, not a recommendation).
The bearish case for the miners has already been established many times over. Recent posts are here, here, here and here.
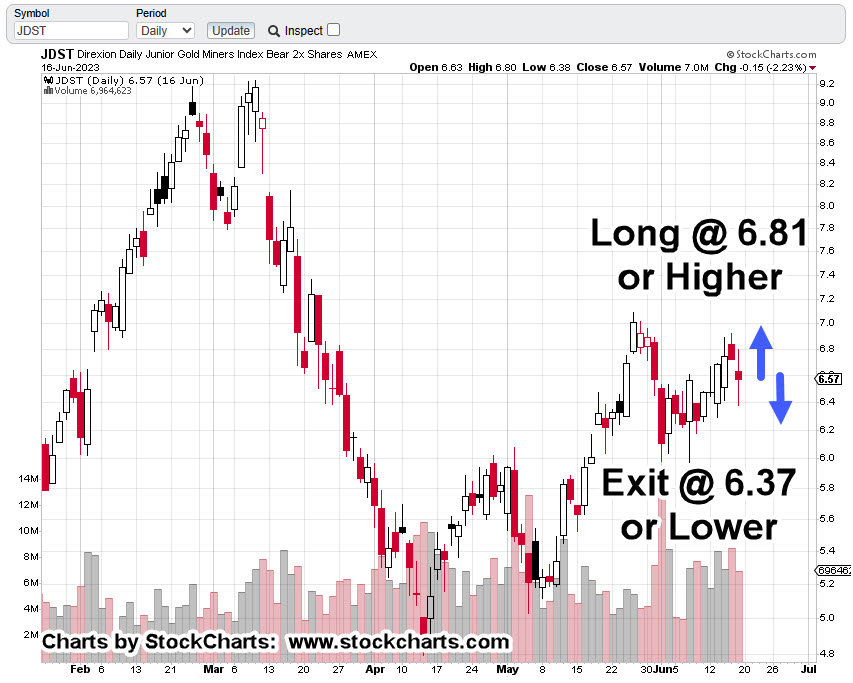
Since we’re looking at the sector from the short side, we’ll use the chart for the leveraged inverse fund JDST.
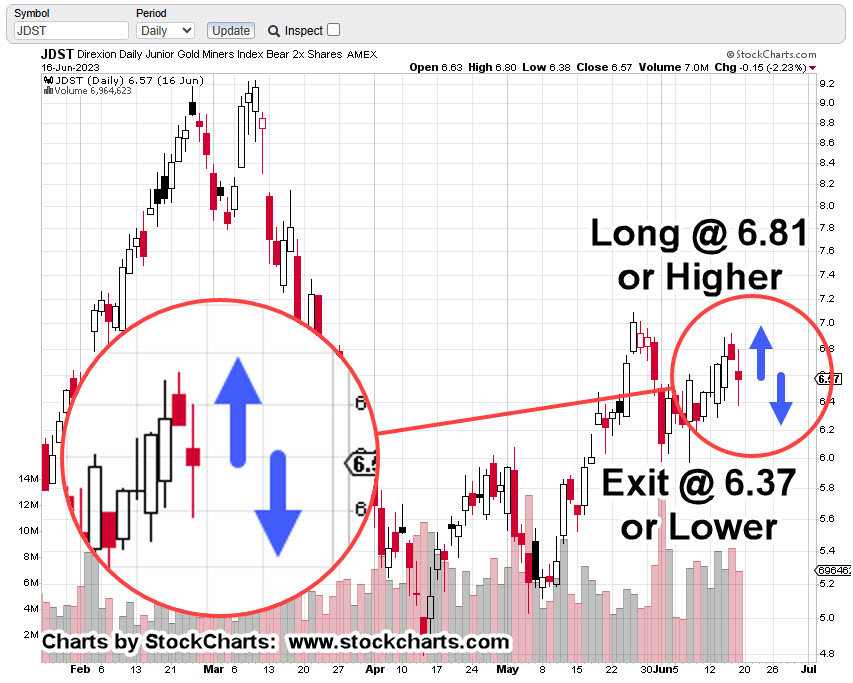
Junior Miners, Leveraged Inverse JDST, Daily
As said at the top, it’s (potentially) straightforward.
If JDST, price action exceeds 6.81, a full position will be entered with hard stop at this session’s low (determined at the close of the day).
If price action declines to 6.37, or lower, the existing (small) position is closed out.
Closer in, with a zoom of the price action.
As of this post (8:41 a.m., EST) JDST is trading in the pre-market slightly higher at, 6.65 which is + 0.08, or + 1.22%.
Note: Posts on this site are for education purposes only. They provide one firm’s insight on the markets. Not investment advice. See additional disclaimer here.