Note: Posts on this site are for education purposes only. They provide one firm’s insight on the markets. Not investment advice. See additional disclaimer here.
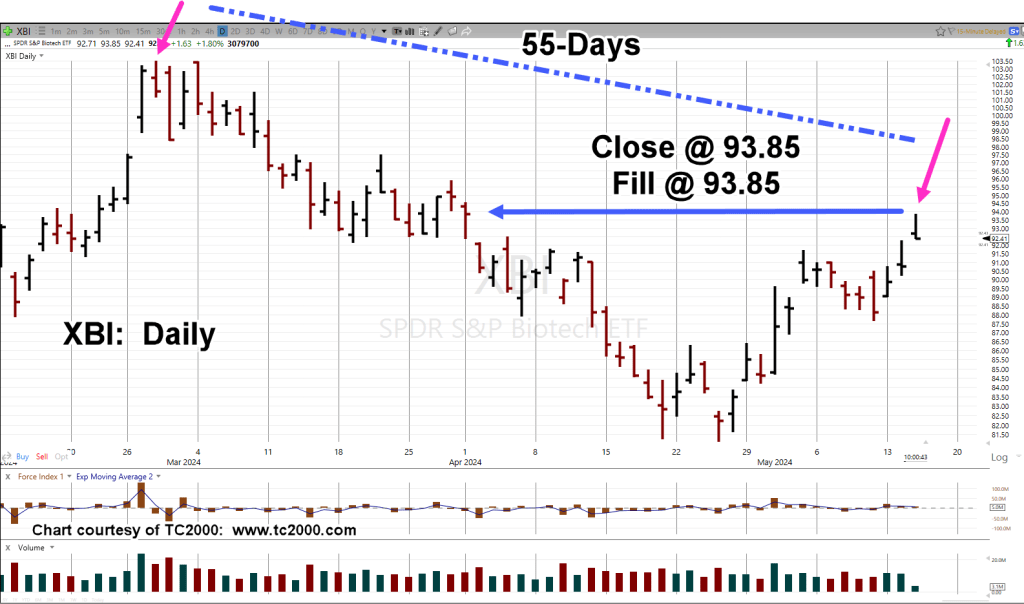
Was this morning’s launch higher in biotech a ‘gut-check’ of the up-thrust (set-up), or just filling the gap left from the April 2nd, move lower?
The Fibonacci 55-Day, count remains intact as it moves from the closing high of February 27th, to the ‘print’ high of the 28th.
As of this post (10:40 a.m., EST), XBI has already retraced back to the top of yesterday’s trading range.
As we look at the chart, it’s important to note today’s early session high was 93.85, the exact closing price of the ‘gap’ created on April 1st, and 2nd.
Biotech XBI, Daily
If this action really is just a test of the larger scale up-thrust (described here), one gets the sense a significant move lower may be at hand (not advice, not a recommendation).
We’re just over an hour into the session and XBI has posted a clean reversal bar for the first hour.
In the event there’s no significant move lower, and the set-up fails, today’s high represents a good stop level for a short position (not advice, not a recommendation).
Note: Posts on this site are for education purposes only. They provide one firm’s insight on the markets. Not investment advice. See additional disclaimer here.
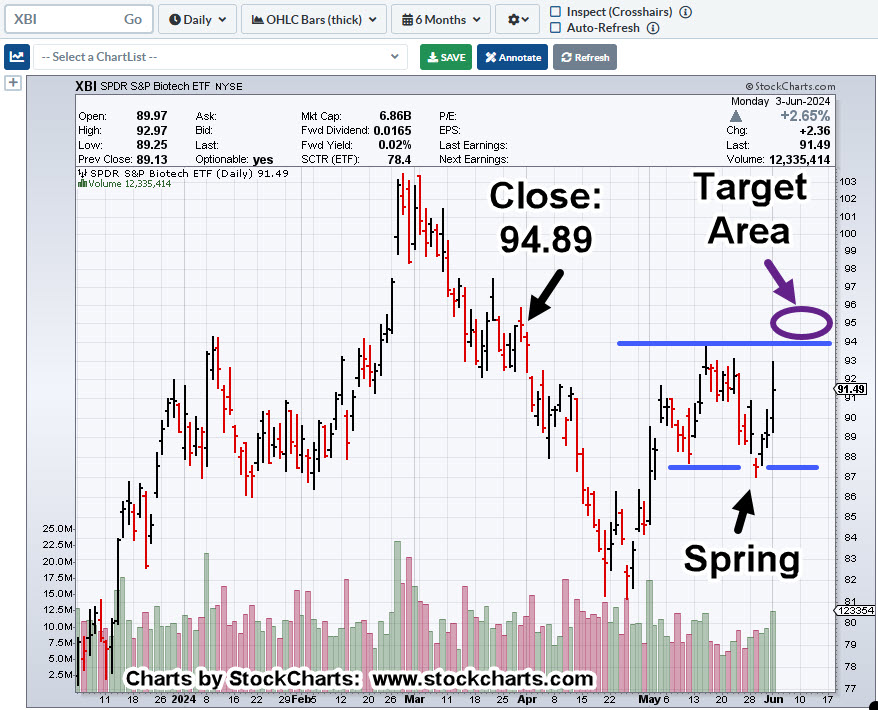
“However, it’s just a sneaky suspicion, XBI may try to inch itself past the daily highs of April 9th, and April 11th (not advice, not a recommendation).”
Fast forward to now and here we are.
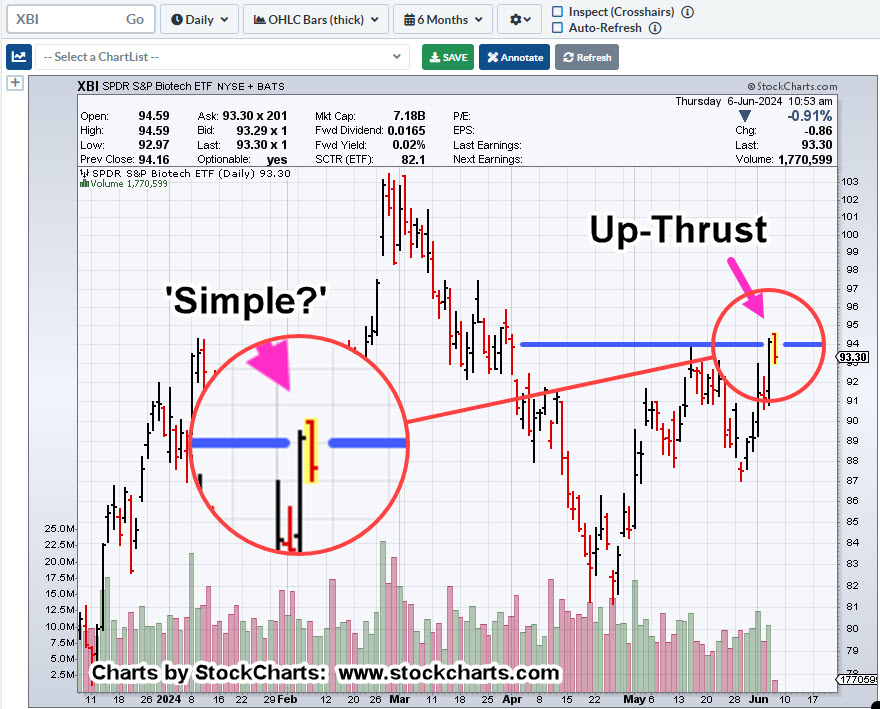
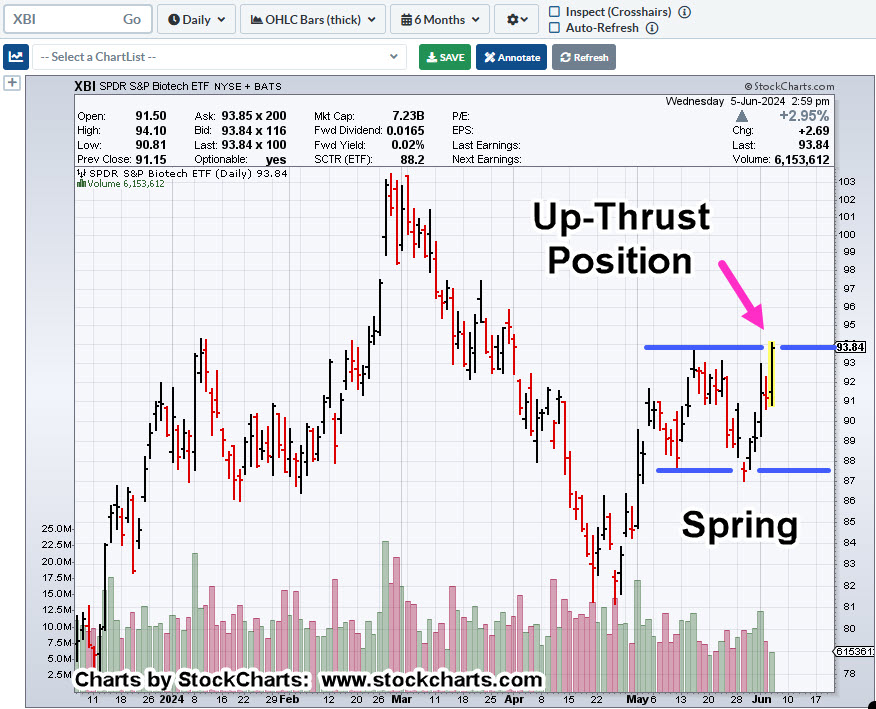
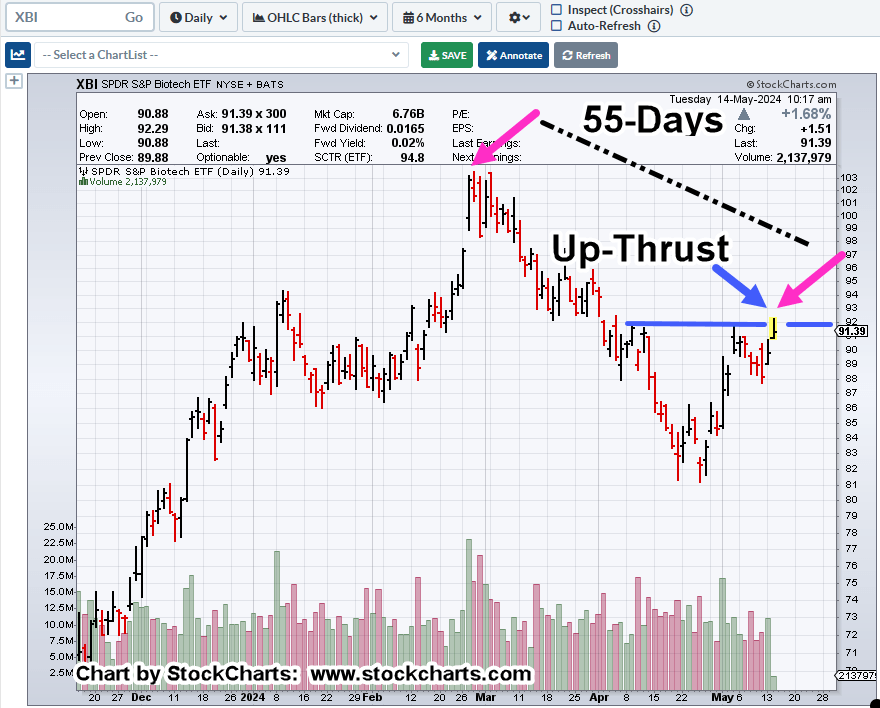
We’re at Fibonacci 55-Days, from the closing high on February 27th; today’s price action opened the session by penetrating highs of April 9th and April 11th.
Doing so, puts XBI in up-thrust (potential reversal) position.
Biotech XBI, Daily
We can say, XBI is at The Danger Point®
As this post is being created (10:34 a.m., EST) price action appears to be eroding from the early session push higher.
The typical market characteristic for XBI, is to retest in the second hour or so of trading; in this case that would mean a move back to the highs.
If that does not happen, it adds weight to the potential reversal scenario (not advice, not a recommendation).
Note: Posts on this site are for education purposes only. They provide one firm’s insight on the markets. Not investment advice. See additional disclaimer here.
When we last left biotech XBI, a push higher into a potential stop-zone was expected, link here.
‘The tape is always right’ as they say, and price action, somewhat unexpectedly, blew past those stop levels.
At this point (12:27 p.m., EST) we’re nearing the 50% retrace on the XBI. That level is somewhere around XBI, 92.28-ish. Currently XBI is trading at 90.12, about 2-points away.
We’ll do a little experiment with the weekly chart by inverting it to show the longer-term view.
Biotech XBI, Weekly (inverted)
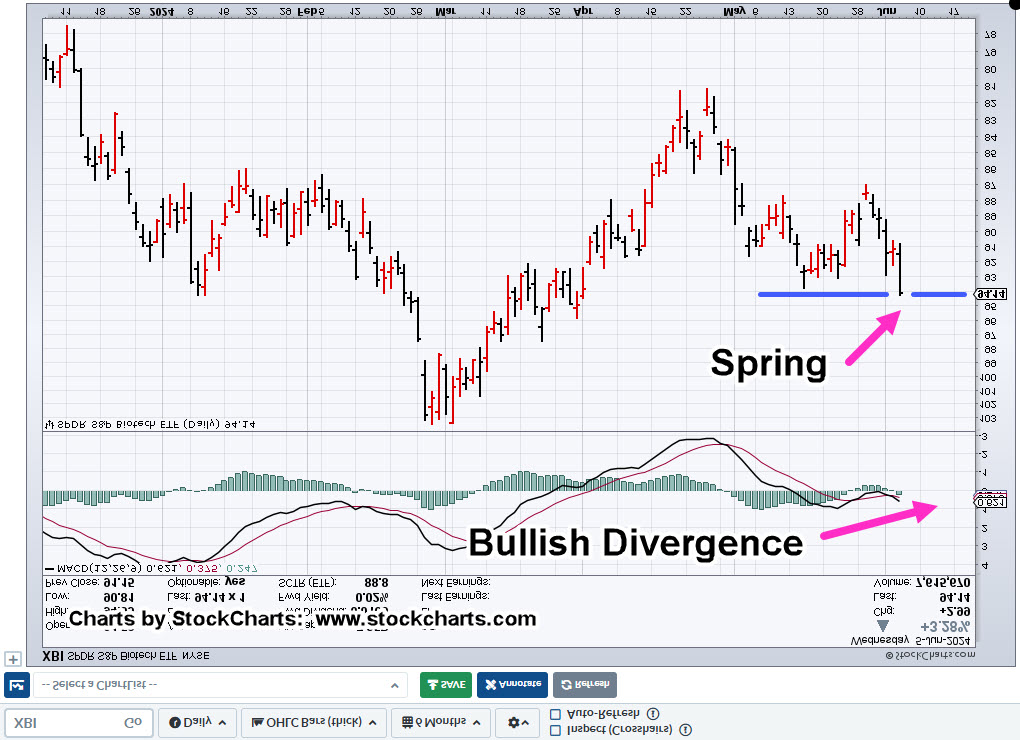
Note the MACD lines are still crossed to the upside.
One way to look at the action is that we’re in a test of the spring set-up (up-thrust, non-inverted).
The retrace to the 50% level may have already happened with last Friday’s action.
However, it’s just a sneaky suspicion, XBI may try to inch itself past the daily highs of April 9th, and April 11th (not advice, not a recommendation).
Note: Posts on this site are for education purposes only. They provide one firm’s insight on the markets. Not investment advice. See additional disclaimer here.
As former floor trader Richie Naso says, ‘You have to think like a criminal’ (time stamp 10:50).
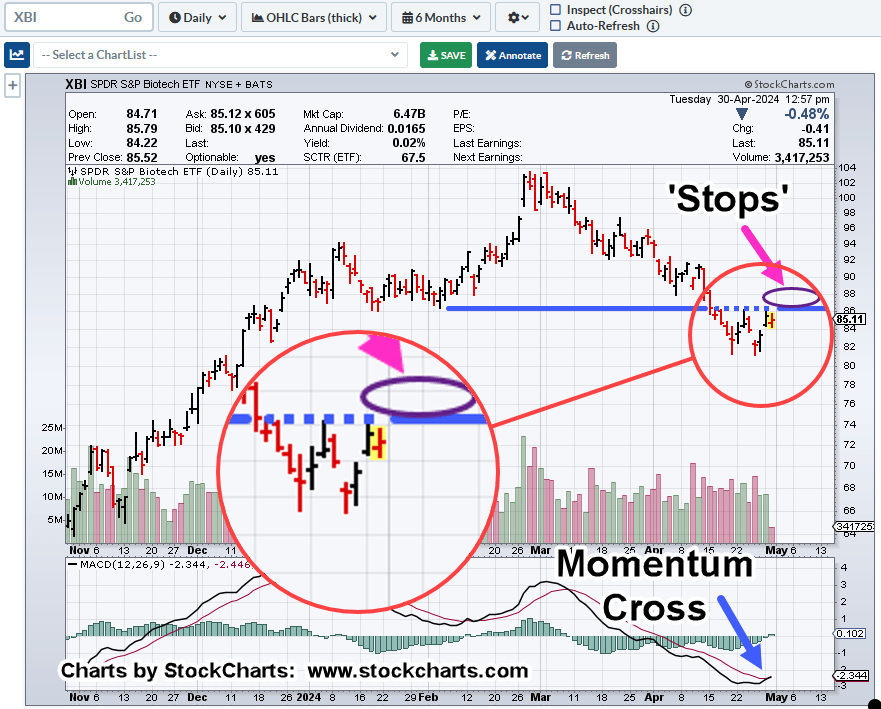
Using his example, a market-maker executes orders ‘to create liquidity’; where on the chart of biotech XBI (below), would that bundle of ‘order’ liquidity exist?
Biotech XBI, Daily
The purple oval shows where there’s a potential of congregated ‘stops’.
Also note, the MACD cross.
This trigger signal is on the Daily MACD, only as the weekly shows longer term momentum continues lower (not advice, not a recommendation).
At this juncture, XBI has broken out of previous trend channels and so, we have a new construct.
Positioning
Presently, I have no open positions in biotech (not advice, not a recommendation).
Back in the day, I would likely be holding short, placing my stops exactly at the location of the purple oval.
Let’s see if the market searches out my old stop location that if hit, would have taken me out of position (via LABD) right in time for a potential reversal to the downside. 🙂
Note: Posts on this site are for education purposes only. They provide one firm’s insight on the markets. Not investment advice. See additional disclaimer here.
How do you know if it’s a countertrend move, or an outright reversal?
Do you stay with the trade or, as Dr. Elder said, ‘do you just take the money and run?’
For biotech XBI, it’s been a nasty two days of upside for any short positions, but the real question is, are we there yet?
Looking at the charts below, you’ll have to decide for yourself.
However, from my perspective, it’s possible that ‘today is the day’; meaning, we may be at the top of the correction (not advice, not a recommendation).
Biotech XBI, Daily
The chart is self-explanatory.
From the day a ‘change of character’ was identified to last Friday’s low, is a Fibonacci 21 days.
From that low to today, is a Fibonacci 3 Days.
We’ll compress the chart scale for a bigger picture view of the current action.
Also included is the grey centerline, showing the channel has a symmetrical ‘look’.
Also note, we’re at a 23.6%, retrace at the day’s high (thus far) and price action appears to be eroding downward.
Note: Posts on this site are for education purposes only. They provide one firm’s insight on the markets. Not investment advice. See additional disclaimer here.
When’s the last time you saw a P&F chart on any (other) website or YouTube, channel?
My guess … probably a long time ago, or never.
Even StockCharts, recently revamped their site, removing the landing page option for P&F. It’s still there, but you have to search to find it under ‘more tools’.
If we’re going to be using Wyckoff analysis to determine the most probable direction for the market (and how far it could go), then P&F analysis is part of that effort.
For our biotech example, XBI, we’ve used two projection methods to see where price action is likely to go if we have a sustainable downturn in progress.
Biotech XBI, 3-Point P&F
As a reminder, ‘3-Point’ means before an ‘X’ or ‘O’ is charted (for reversal), the index must move at least 3-points.
Based on the P&F action itself, we have a projection range (not advice, not a recommendation).
Now, comes the interesting part, Fibonacci projections.
Biotech XBI, 8-Day, w/Fibonacci
The Fibonacci projections are shown as the blue lines.
The P&F projections from the chart above, are overlaid as the magenta lines.
Of course, projections do not guarantee anything.
At the next open, XBI could launch itself into a upside reversal; not likely, but it could happen.
Wyckoff Cause & Effect
What we’re doing here, is adhering to Wyckoff discipline from his stock market course material (still available here).
No position, long or short is entered unless there is sufficient cause i.e., P&F count for a sustained move.
Note: I have no affiliation with the Stock Market Insitute and do not receive any compensation from them.
In the case of biotech XBI, above, it literally has spent years generating a P&F count; the ’cause’.
The ‘effect’, is the actual move; now potentially in progress.
Note: Posts on this site are for education purposes only. They provide one firm’s insight on the markets. Not investment advice. See additional disclaimer here.
In the case of biotech XBI, it may have started the ‘dynamic phase’, suggested two days ago, in this update.
Then, there’s Elliott Wave.
Back in the day, while being mentored by the late David Weis, he revealed his ‘love/hate’ relationship with the method.
His quote to me was “Intermittent reinforcement, is a hook”; meaning, it works just well enough (but not profitably enough) to keep you coming back to ‘get it right’ next time … which never comes.
For me, I’m not going to use the approach for trading decisions, but highlight in the case of XBI, we just might have an Elliott Wave structure (not advice not a recommendation).
Biotech XBI, Weekly
If this structure’s correct, a lot can happen on the way to the end of ‘Wave 3’.
Note the XBI, topped-out right at the 38.2%, retrace in March (labeled, as ‘Wave 2’), before reversing lower.
Big In, Big Out
The chart above is a massive structure; years of action to form the top, reversal, counter trend wave, then reversal again, which is where we are now.
Note: Posts on this site are for education purposes only. They provide one firm’s insight on the markets. Not investment advice. See additional disclaimer here.