Two-Weeks of Churn

The SOXX, has been churning at 510- 525, for over two weeks with no net progress.
What happens if it can’t go materially higher?
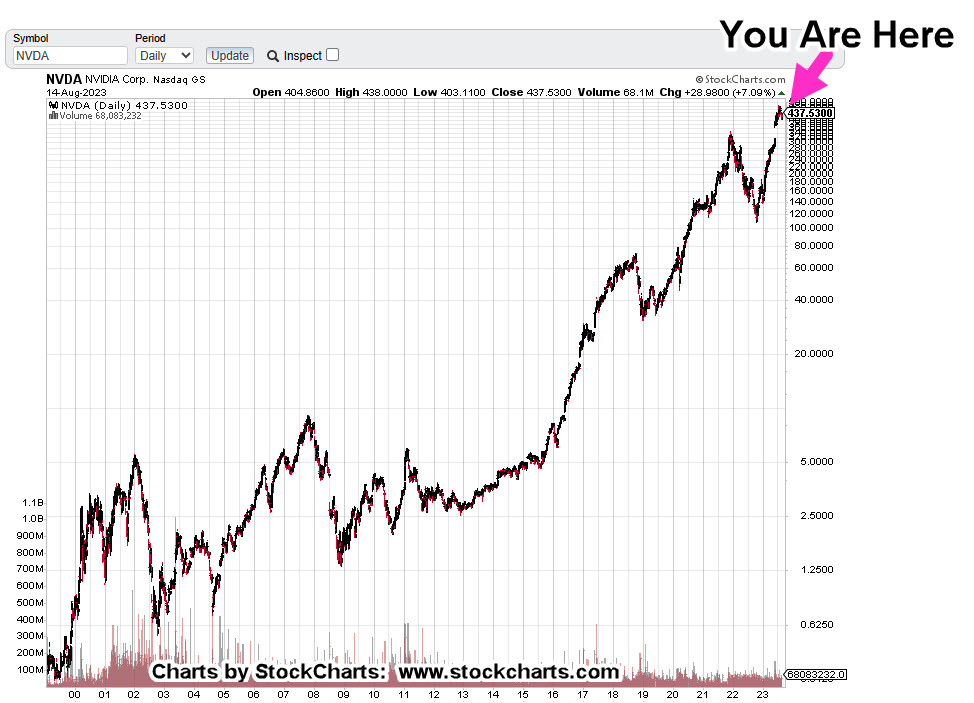
It’s reasonable to think, good news is already out; evidenced by Nvidia’s price action.
If we look at NVDA, using it as the proxy, it has reversed off all-time highs, slipped below support and on Friday, came back to test; a weak one at that (so far).
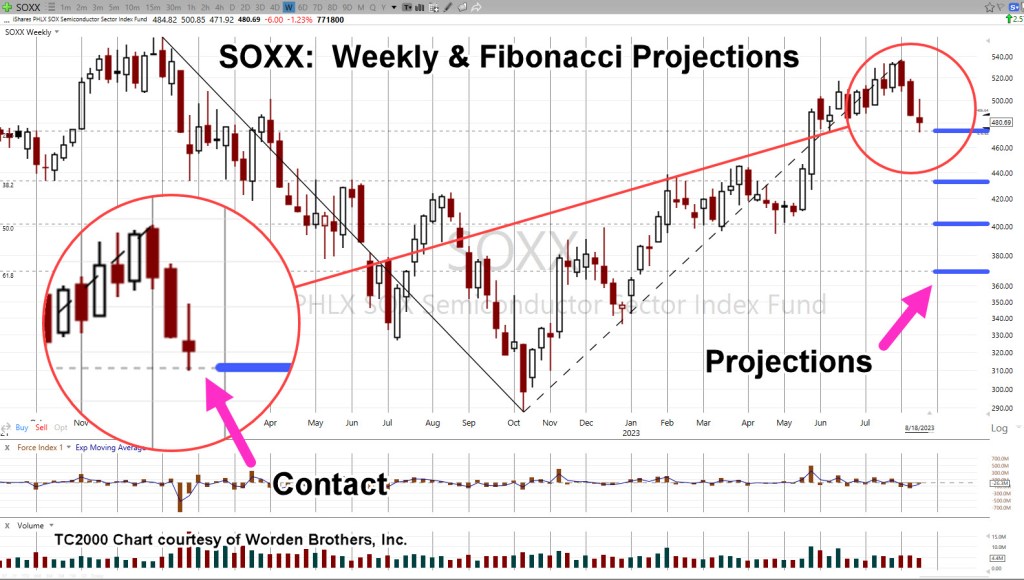
SOXX Highs, Long Ago
The SOXX posted its all-time-highs nearly two years ago with the most recent rebound in August, this year.
Now, after a subsequent move lower, price action has come back up to test, forming an apparent hole.
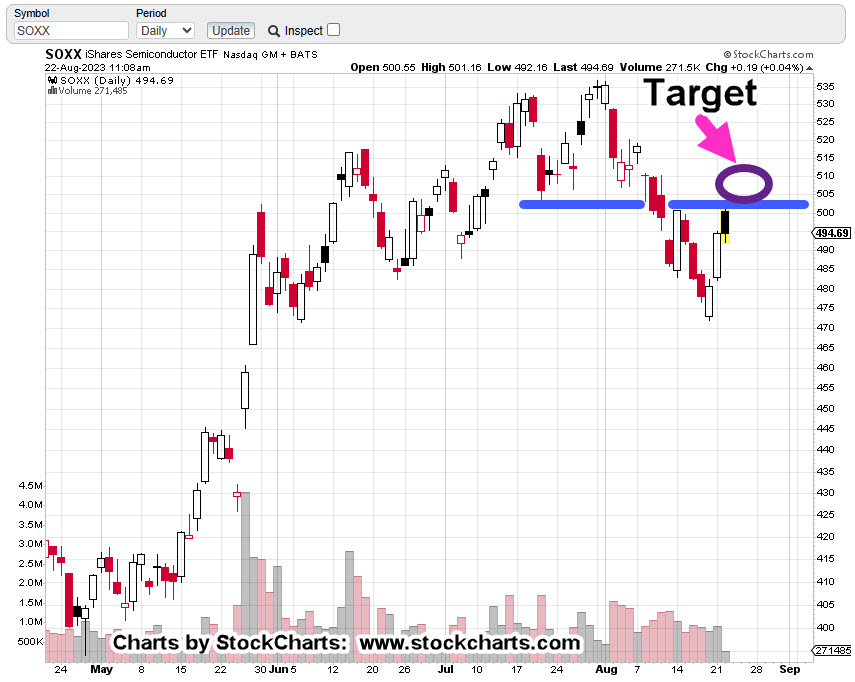
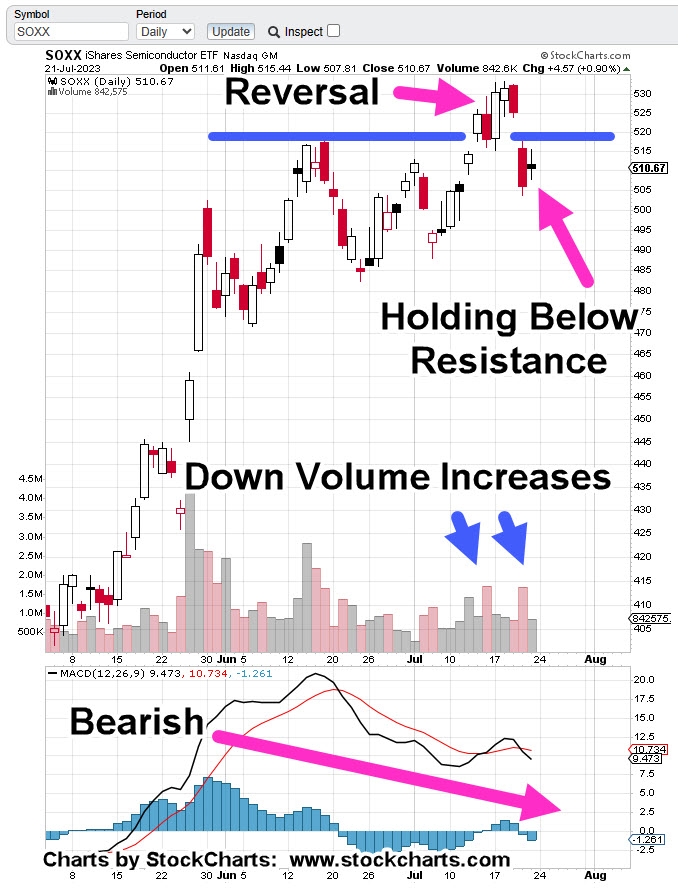
Semiconductor SOXX, Daily
The chart says it all; We’re at The Danger Point®

Price action appears to be struggling at this level.
If it can’t break higher and/or, posts a new daily low, it may be confirming a false breakout (Wyckoff, ‘Up-Thrust’).
That would open up possible testing of gaps (lower), potentially the Trading Range lows, as well (not advice, not a recommendation).
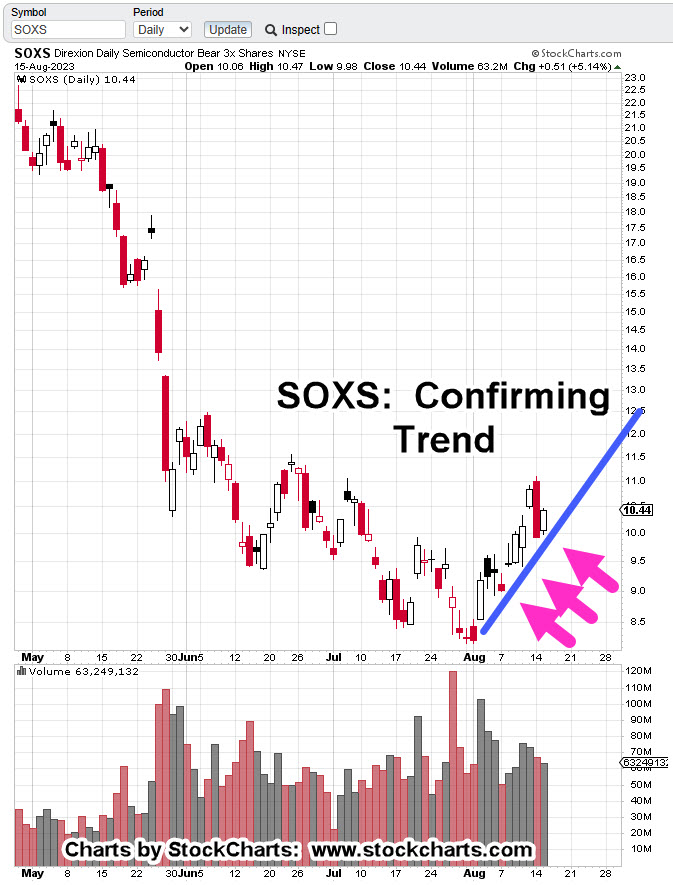
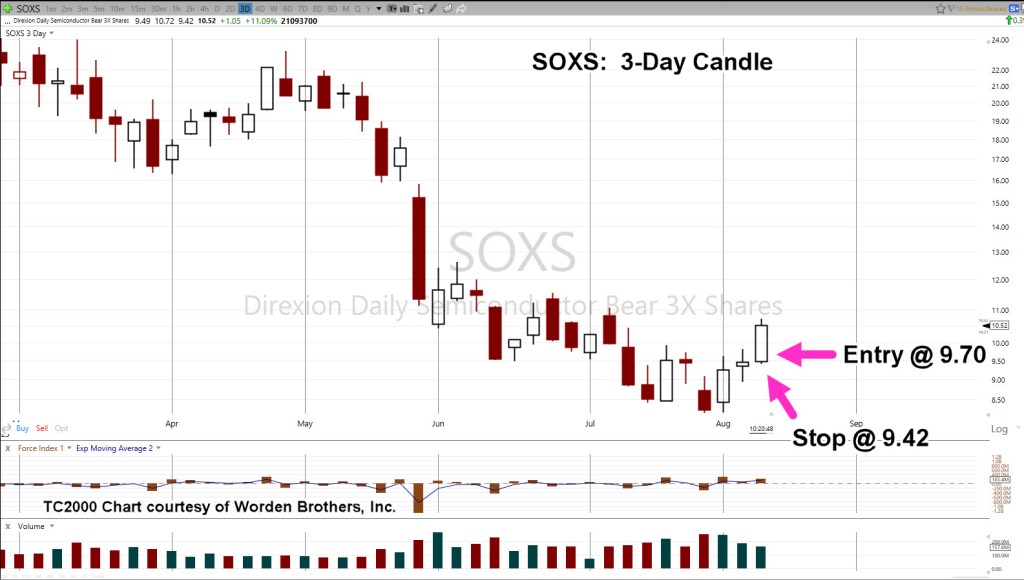
Positioning
As one would surmise, a short position was opened on Friday via Leveraged Inverse Fund SOXS.
Entry @ SOXS 8.59, Hard Stop @ 8.22, Soft Stop (discretionary) @ 8.30 (not advice, not a recommendation).
Trade is labeled: SOXS-23-10
Stay Tuned
Charts by StockCharts
Note: Posts on this site are for education purposes only. They provide one firm’s insight on the markets. Not investment advice. See additional disclaimer here.
The Danger Point®, trade mark: No. 6,505,279