Wyckoff Masterclass

Just twelve days from now, CarMax (KMX) reports earnings.
With that, we already have the backdrop of auto loan implosions; the cratering of Ally Financial (ALLY), link here.
Everybody seems to be waiting for used car prices to decline; conditions may now be in place to support an auto sector markdown.
Price action of CarMax supports the idea that lower prices, at least for KMX, may be just ahead (not advice, not a recommendation).
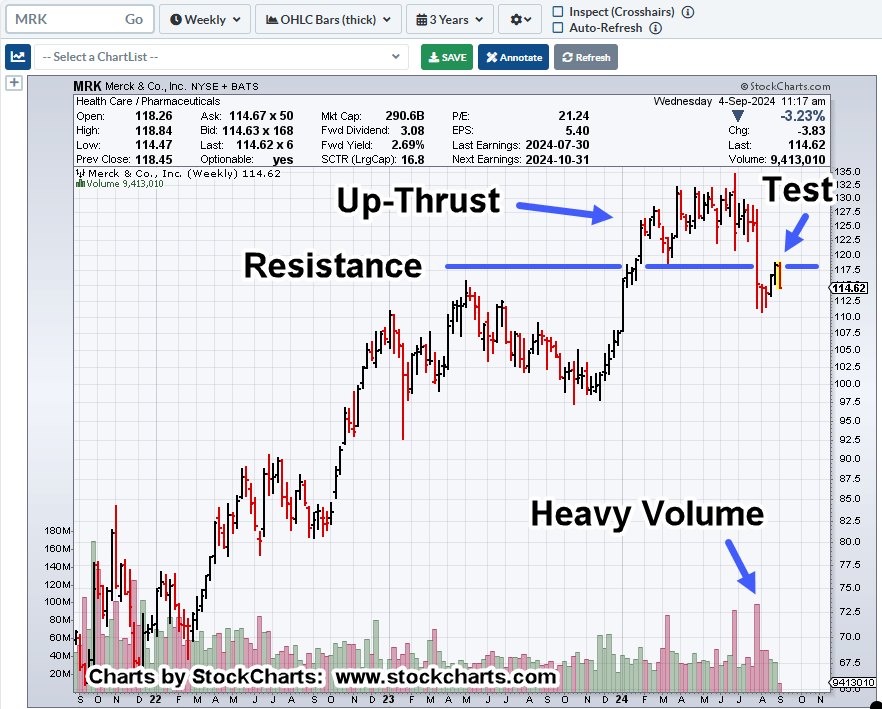
CarMax KMX, Daily
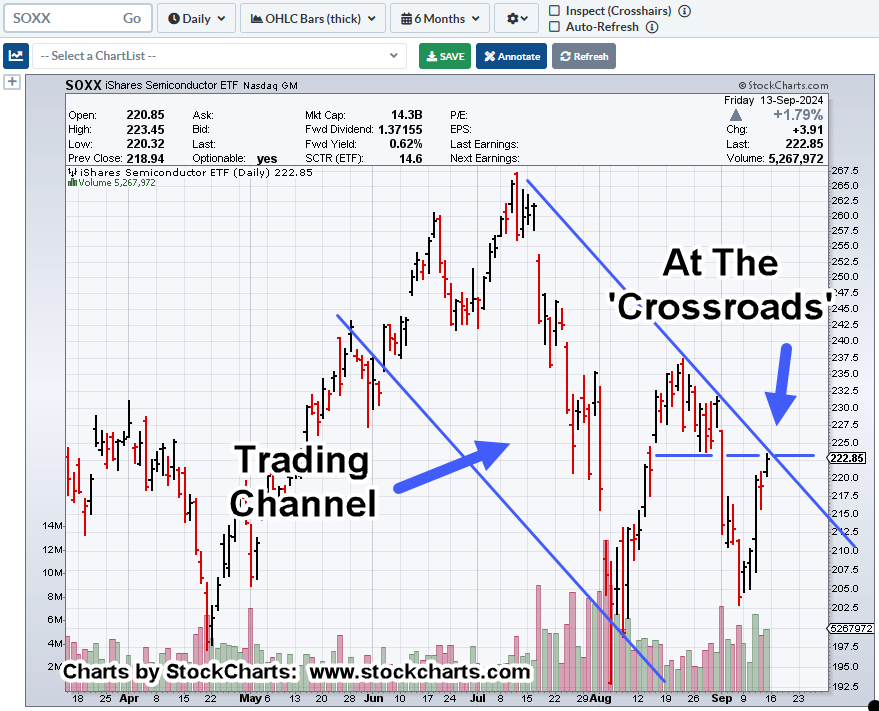
Right now, and similar to semiconductors, KMX, is testing the underside of resistance.

Numerous Wyckoff characteristics are shown.
First, the up-thrust, with a test.
Then, a decline that includes a wide (modestly) high volume bar; now being tested, as well.
Price action at this juncture, is at a Fibonacci 38.2%, retrace of the entire move starting from the August 26th, high.
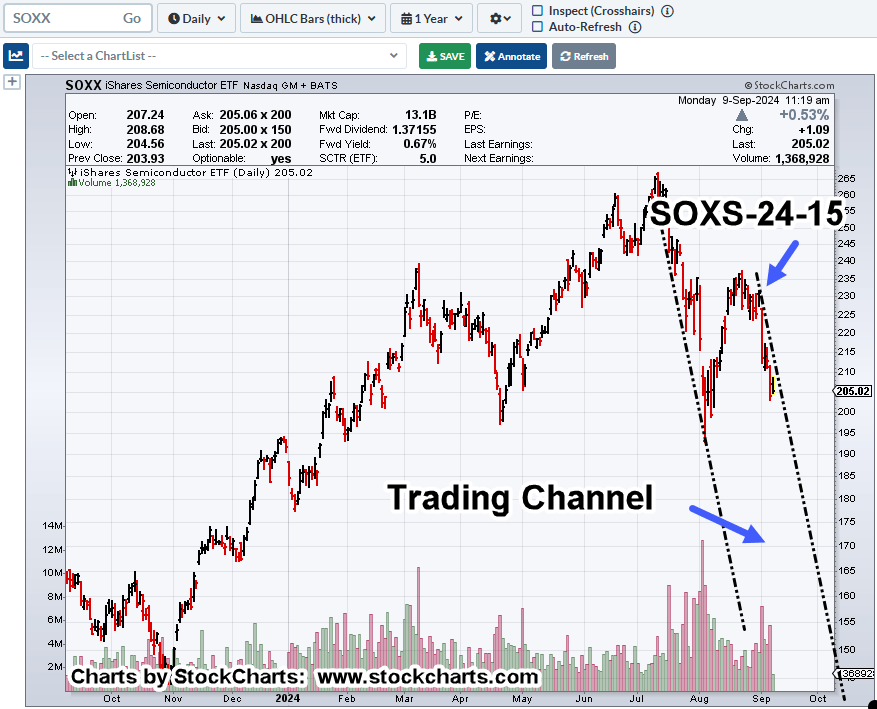
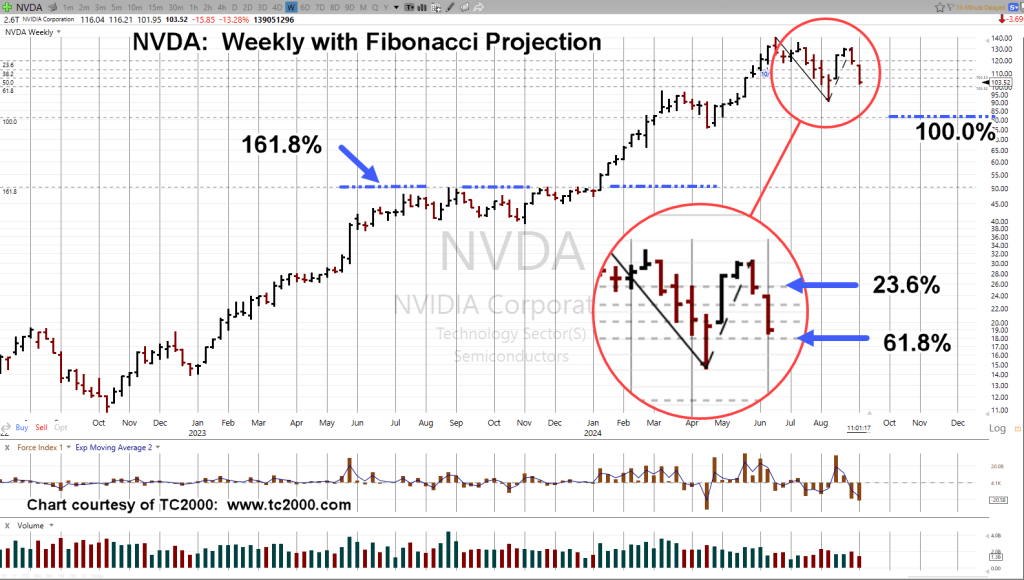
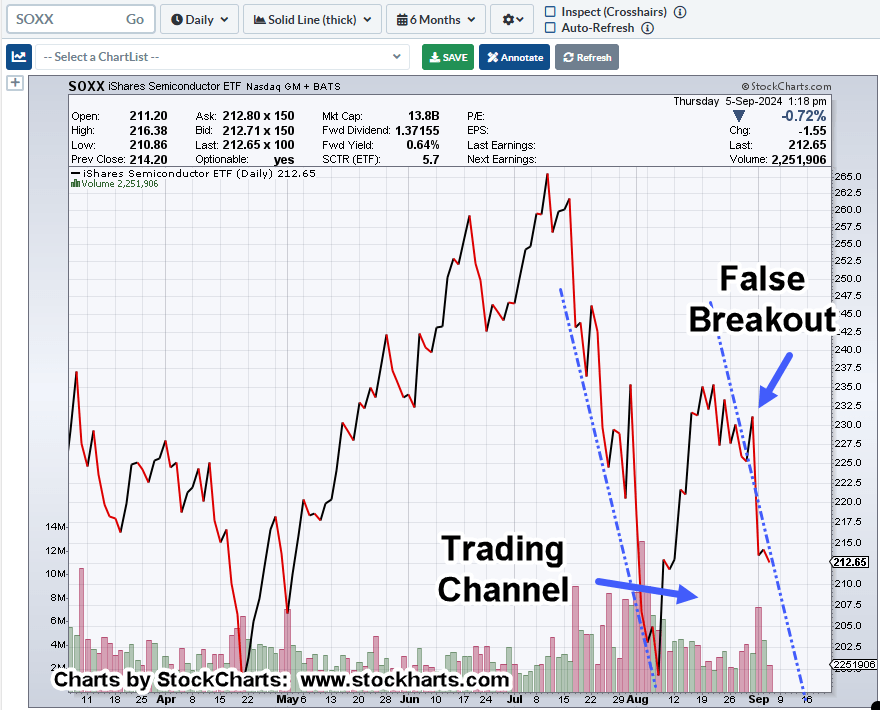
Bear Market Characteristics
As with Nvidia and the SOXX, KMX, is posting wide bars, huge gap moves.
In the six-months of price action shown above, KMX, has oscillated in a range that’s 35%, wide.
This is not bull-market behavior.
Stay Tuned
Charts by StockCharts
Note: Posts on this site are for education purposes only. They provide one firm’s insight on the markets. Not investment advice. See additional disclaimer here.
The Danger Point®, trade mark: No. 6,505,279