Potential Bottleneck

‘Surprises tend to come in the direction of trend’; Jesse Livermore
The potential all-time high (reversal) for Nvidia along with the A.I. bubble, was identified here and here.
If that analysis holds (it is, so far), we’re either in sideways congestion or outright reversal (not advice, not a recommendation).
A Funny Thing Happened
If its reversal, that’s when funny things start to happen.
Like the only ultra-pure quartz mining operation in the world; used for semiconductors, possibly knocked off-line.
That kind of funny.
This article, link here, details potential risk to the semi-industry.
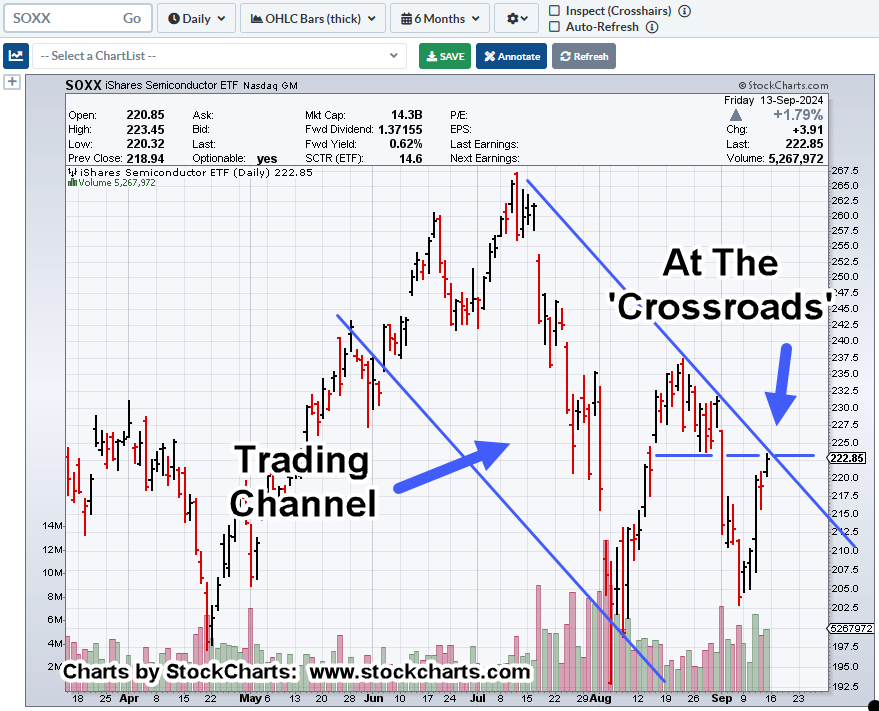
It doesn’t look like the semis’ are waiting around to find out.
The SOXX, just opened lower, currently trading lower (as of 9:42 a.m., EST).
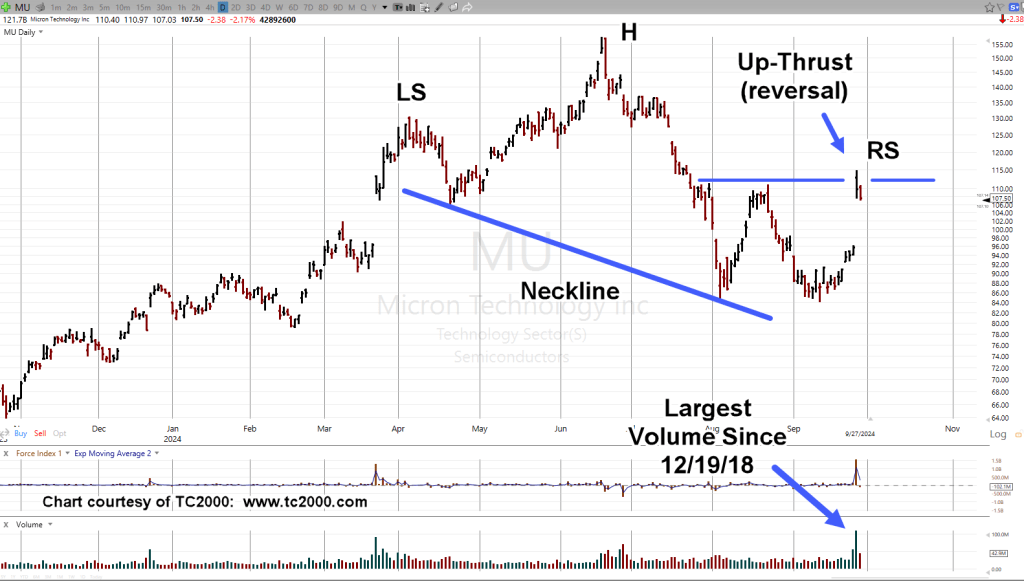
Semiconductors SOXX, Daily
If yesterday was the (up-thrust) test, it was on contracting volume when compared to September 26th’s, resistance penetration.

With this post coming out just before the open on the 27th, the implication was, a short position was about to be opened (not advice, not a recommendation).
Positioning
Entry in SOXS, was at 18.87, early in the session on the 27th; hard stop @ 18.60, the day’s low (not advice, not a recommendation).
Trade labeled SOXS-24-17.
Speculator’s Notes
The objective here is not necessarily to be ‘right’, but to minimize the risk.
With a ‘risk’ (distance between entry and stop) of just 0.27-points, a sizeable position can be opened.
Example. A ‘risk’ of $1,000 means position size is around 3,700 shares of SOXS.
At yesterday’s closing price (20.25), the position of 3,700 shares, would now be up a modest but decent $5,100.
Stay Tuned
Charts by StockCharts
Note: Posts on this site are for education purposes only. They provide one firm’s insight on the markets. Not investment advice. See additional disclaimer here.
The Danger Point®, trade mark: No. 6,505,279