What To Watch

First off, it’s nice to know, traders at J.P. Morgan, don’t have clue as what to do.
They say it themselves; Not One Person
On top of that, I’m supposed to pay money reading about how clueless they are. 🙂
No thanks. Let’s see if we can do better than the average ‘investment firm’.
Before we get started, a reminder; as Michael Cowen says:
‘It’s the bear market that reveals those who really understand’, not the bull market ‘geniuses‘.
With that, let’s get into it; first up, is silver.
Silver: Wyckoff Analysis Results
The downside reversal was identified to the day.
Adding to that post, Europeans could not only be freezing or starving this winter, but also subject to radiation poisoning.
Surely, they’re all thinking that ‘stack’ of silver is going to save them.
Silver (along with gold) remain trending lower.
Silver (SLV) is currently at support levels; therefore, some upward action (staying below SLV: 18.5) is normal behavior.
Bonds: Are They Ready?
Hold your nose … bonds could be setting up for a rally.
As Steven Van Metre reports here, the Fed ‘shenanigan’ meter is pegged.
Bonds, TLT Weekly

Note, the bullish TLT, set-up is not confirmed until MACD ticks higher (not advice, not a recommendation).
Also note the repeating pattern of ‘spring to up-thrust‘.
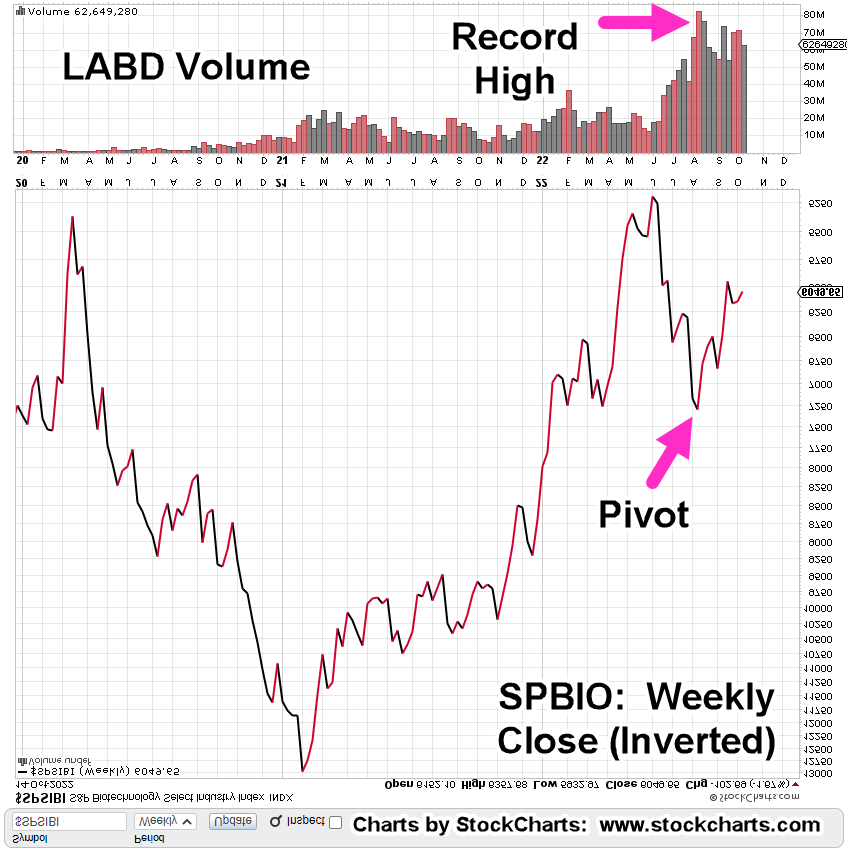
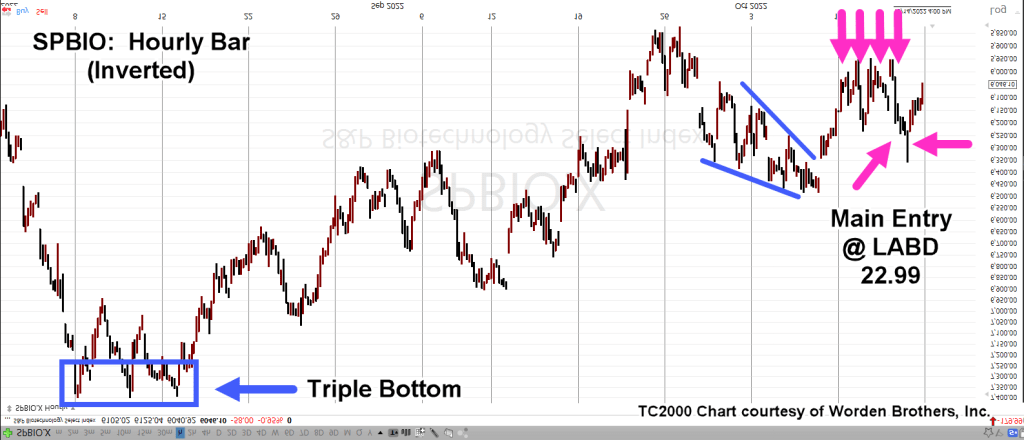
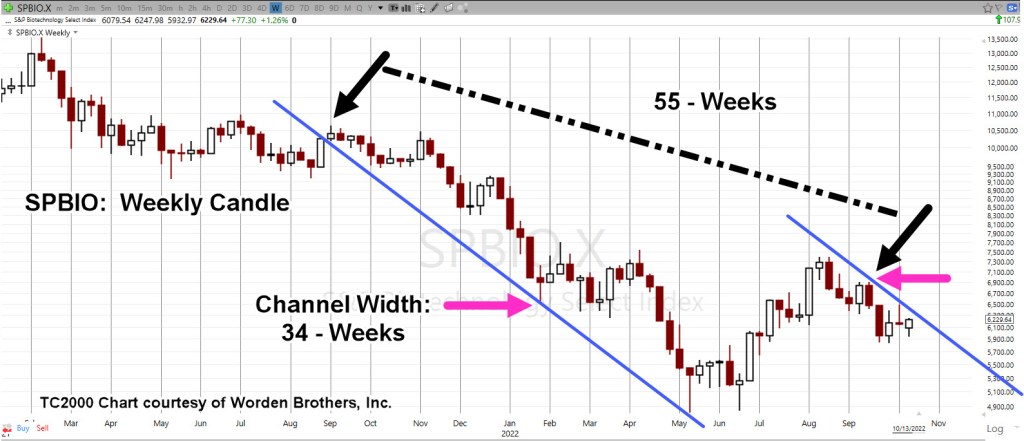
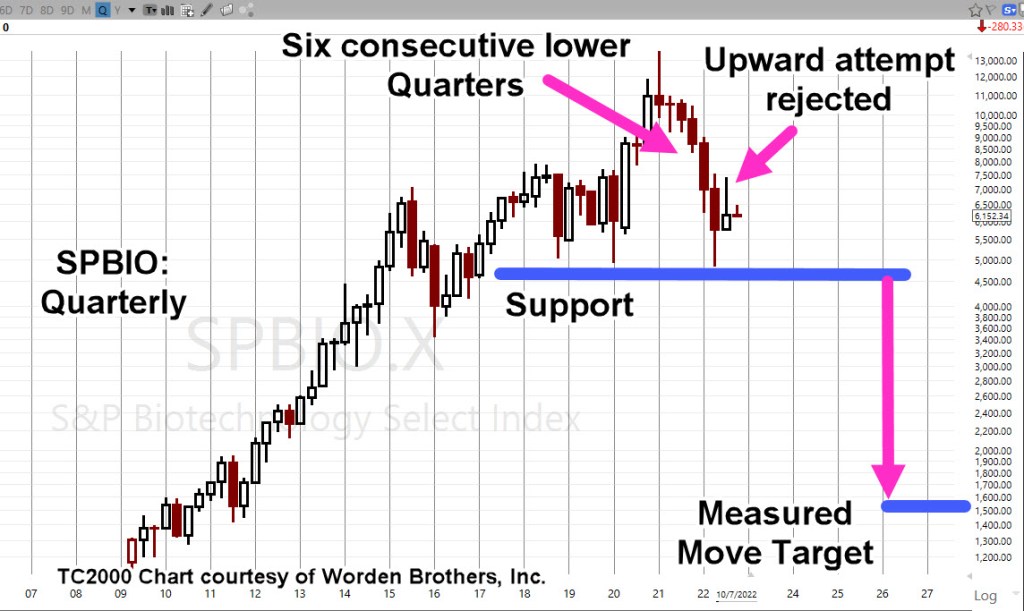
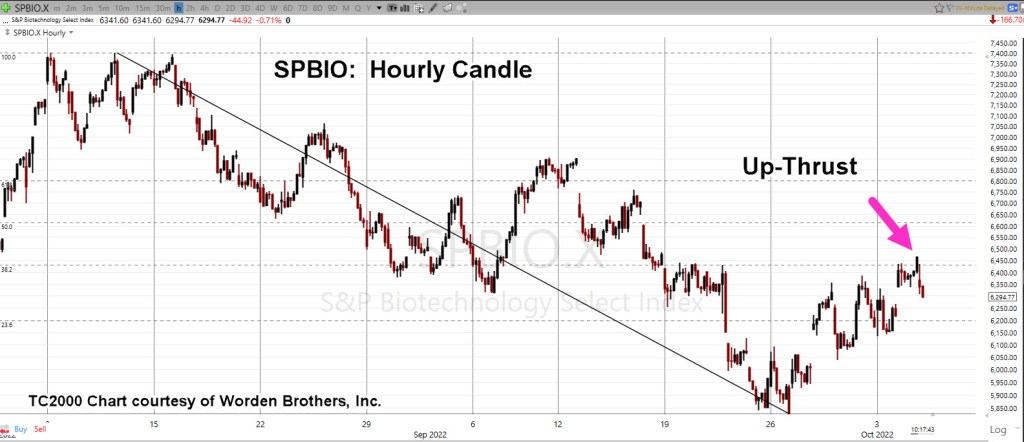
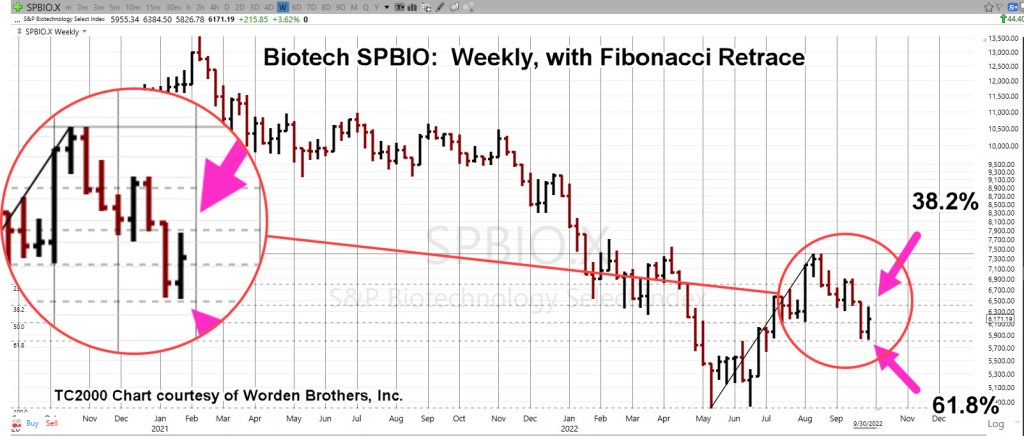
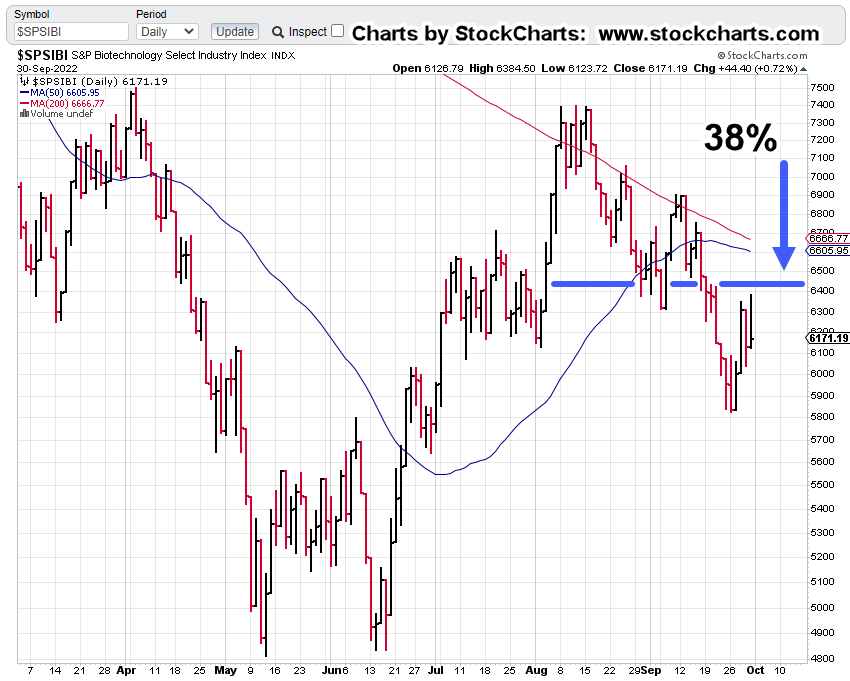
Last up, biotech
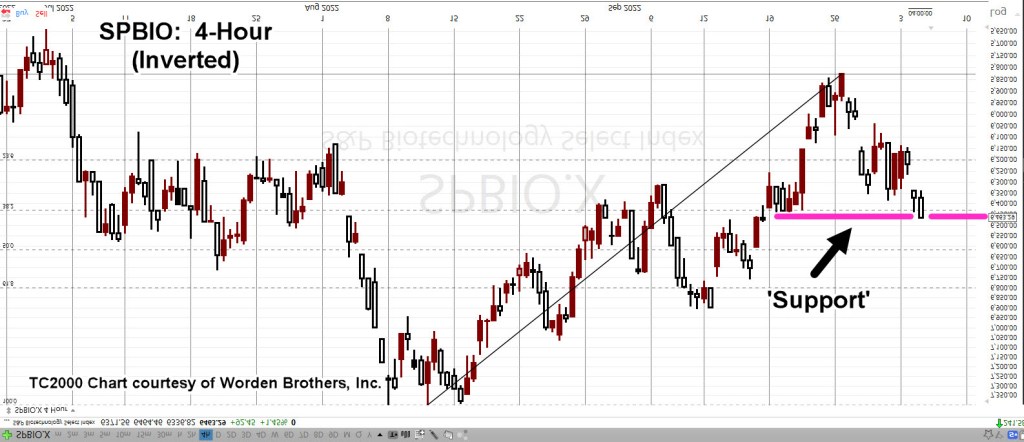
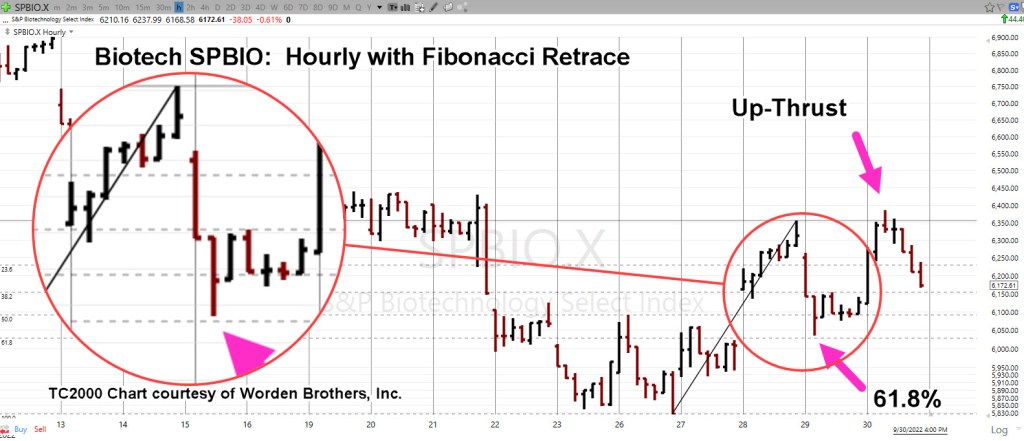
Biotech SPBIO, Hourly (Inverted)
We’re going to use the chart from yesterday’s post to set the stage for getting closer-in.

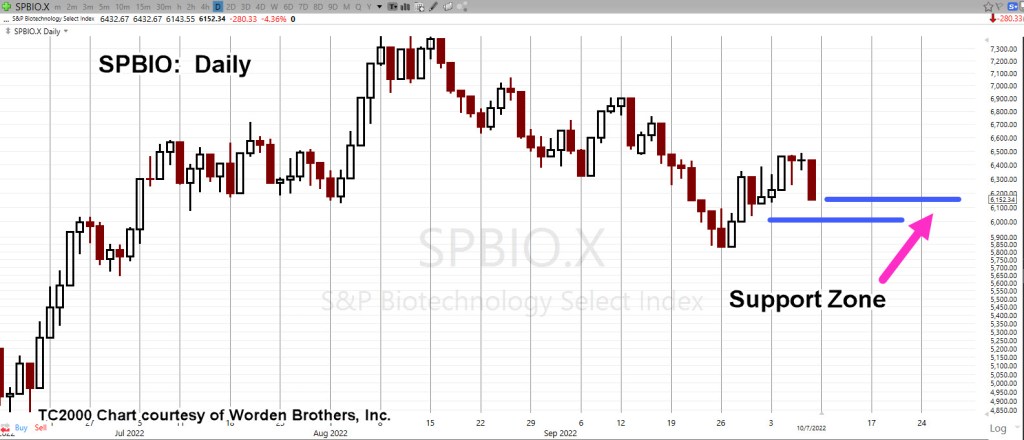
This past Friday’s early morning ‘spike’ is barely visible; the 30-minute (inverted) chart below, has more detail.
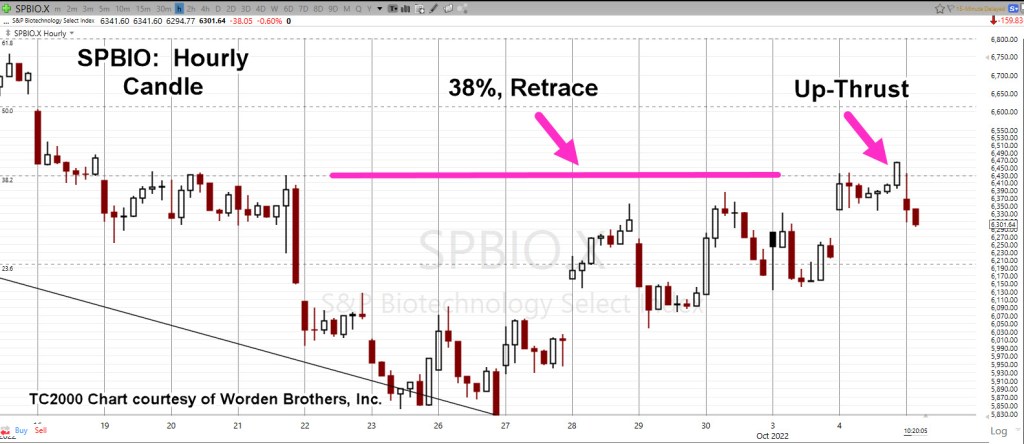
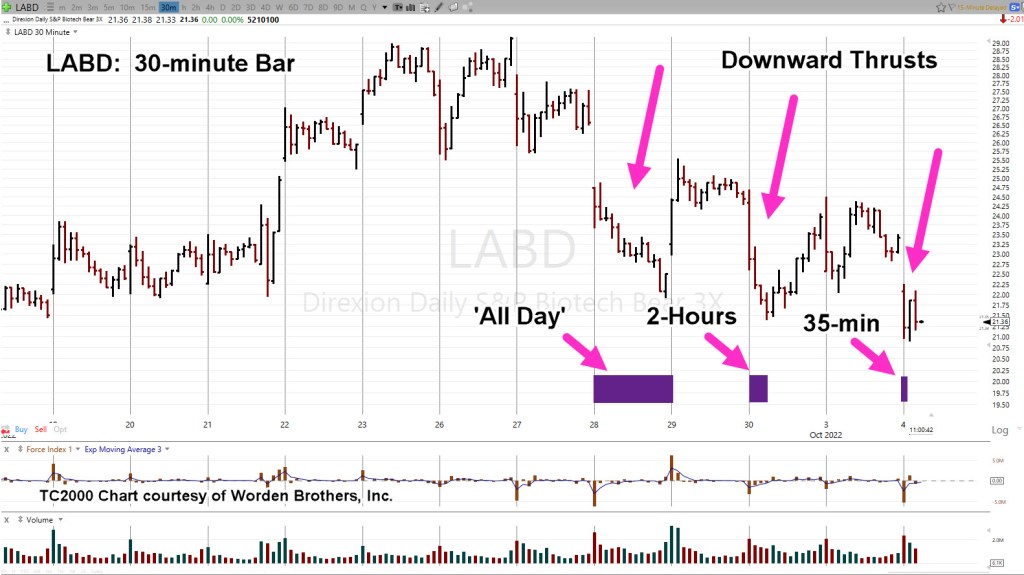
SPBIO, 30-minute (Inverted)

Price action rejected the lower levels (higher on SPBIO) and pulled away throughout the session. That ‘pulling away’ continued on, all the way into the close.
That’s a clue there may be follow-through at the next session.
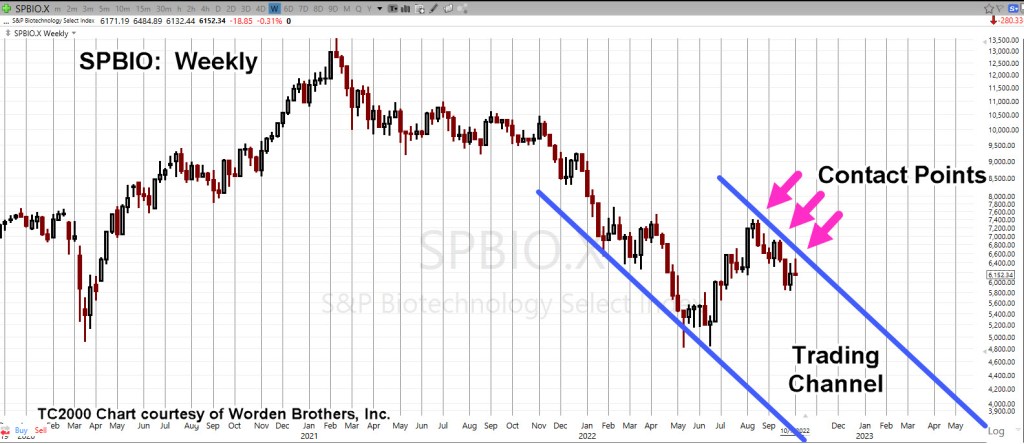
If the early session opens ‘gap-higher’ (SPBIO, lower), into the resistance area (four magenta arrows, hourly chart), it would be the fourth time pressuring at this area; markets rarely hold a fourth attempt.
Summary
Of course, other markets are being watched like real estate (IYR), Tesla (TSLA), and even Basic Materials (DJUSBM), a potential sleeper for significant downside.
Updates are planned if/when low risk shows up.
Positions: Current Stance (courtesy only, not advice).
The following is the positioning of my firm’s main (largest) account.
LABD-22-08:
LABD Entry @ 25.1278, 24.735, 26.025, 22.99, 22.29***, Stop is @ LABD 21.23***
***, Indicates change
Note: Positions may be increased, decreased, entered, or exited at any time.
Stay Tuned
Charts by StockCharts
Note: Posts on this site are for education purposes only. They provide one firm’s insight on the markets. Not investment advice. See additional disclaimer here.
The Danger Point®, trade mark: No. 6,505,279