Note: Posts on this site are for education purposes only. They provide one firm’s insight on the markets. Not investment advice. See additional disclaimer here.
Note: Posts on this site are for education purposes only. They provide one firm’s insight on the markets. Not investment advice. See additional disclaimer here.
Last week, Senior Miners GDX, broke out of a bear flag to the downside.
There could be a little more momentum lower before reaching support in the area of 33 – 34.
After that, expect a test to the underside of the flag. This is typical market behavior.
If that happens, we’ll have familiar gold bull hysteria ‘this is it!’ All the while, GDX and gold (GLD) grinding lower.
Recall gold (and related), is a very crowded trade. Eventually, there will be a sustained bull market … probably after all have grown weary hearing the rumor of it.
Anecdotally, remembering entries from a diary during the 1932 lows (the actual source has been lost), were to the effect:
‘Everybody knew that major stocks were a once-in-a- lifetime deal, but nobody had any money‘.
That lifetime deal, or deals may come. The objective is to survive, prosper and be ready when it gets here.
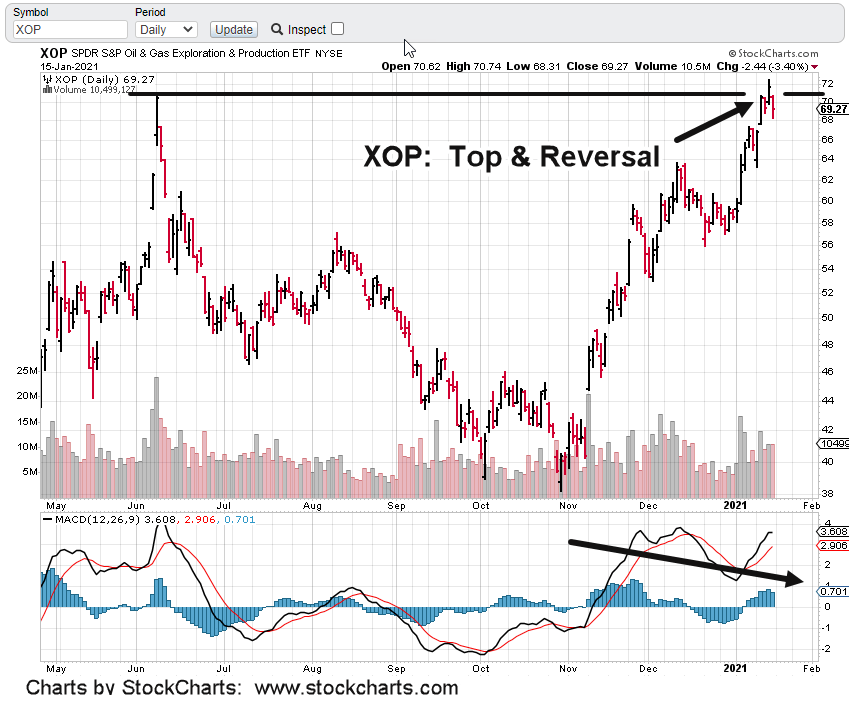
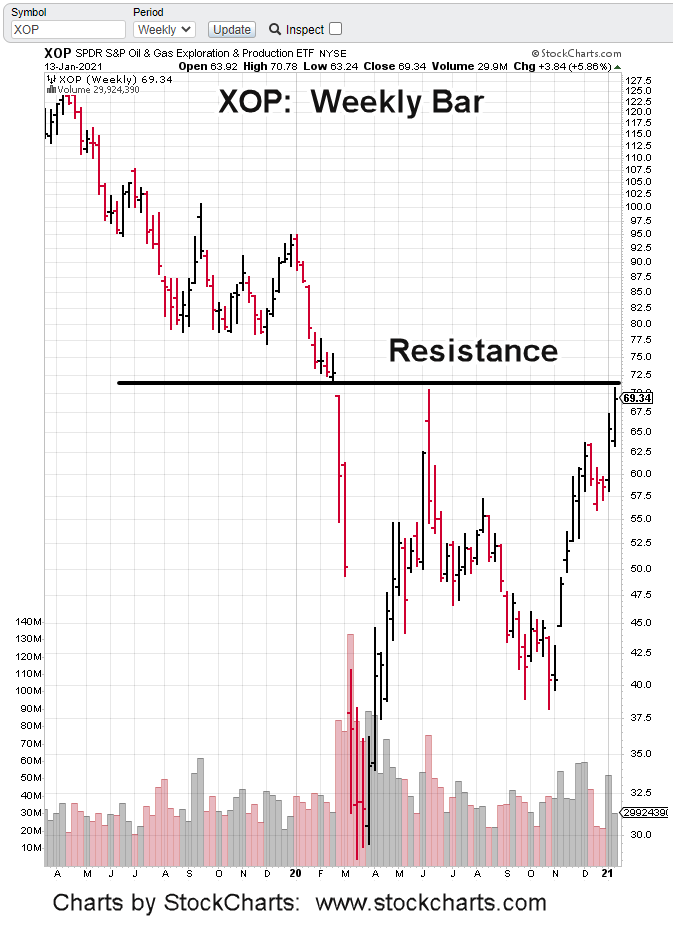
With that, there’re probably much better opportunities for a directional move to the downside.
Real estate, Oil & Gas Exploration sectors come to mind.
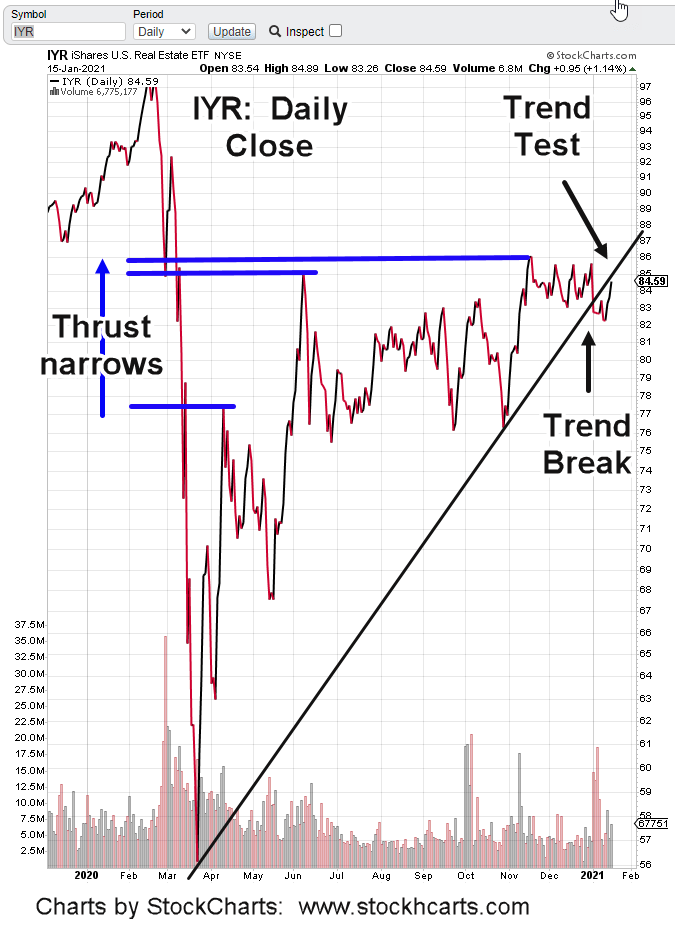
On the real estate side, it’s unfortunate, sad, but entirely possible a significant number of those to lose their homes through foreclosure, are somehow going to be housed in now-empty, or near empty commercial (mall) areas or office buildings.
If so, that relocation process will take a significant amount of time. The value of IYR’s components (SPG, EQR, etc.) may reach some type of bottom before it’s all straightened out.
We’re already past the beginning stages of a massive life-long depression.
Getting focused on it, is difficult but best if one is to come out the other side intact; or better yet, well positioned to re-build.
Note: Posts on this site are for education purposes only. They provide one firm’s insight on the markets. Not investment advice. See additional disclaimer here.
Two reports discussing the exact same topic, are linked here and here.
One of the reports is fact; the other is fiction.
Just two minutes, and twenty-eight seconds into one of those, the fairly tale begins.
The other has its head on straight and is on-target with truth; a disturbing truth.
Alas, the hyper-inflation narrative runs deep. Comments from the last Van Metre report shows just how deep the rabbit hole goes.
We’ll paraphrase:
‘GDX filled the downward gap … metals to skyrocket higher’.
With every day that passes, we see truth of what comes first; as reported here, it’s corn first, then gold & silver.
Putting it differently; seed producers can’t keep up with demand.
At least one supplier linked here, is shut down … temporarily they say because of huge order backlog.
Interesting their planed re-open, is for the 20th. We’ll see if that happens.
Way back in April last year in at least one state, it was illegal to buy seeds. That same scenario never happened with precious metals.
Are the coin dealers shut down? Precious metals may indeed become important at some future date. However, at this juncture it’s easy to hypothesize you won’t be able to buy or sell without ‘speck’ protection.
Getting that protection essentially makes being around to see (or function in) the future a moot point; doesn’t it?
Stay Tuned
Note: Posts on this site are for education purposes only. They provide one firm’s insight on the markets. Not investment advice. See additional disclaimer here.
Note: Posts on this site are for education purposes only. They provide one firm’s insight on the markets. Not investment advice. See additional disclaimer here.
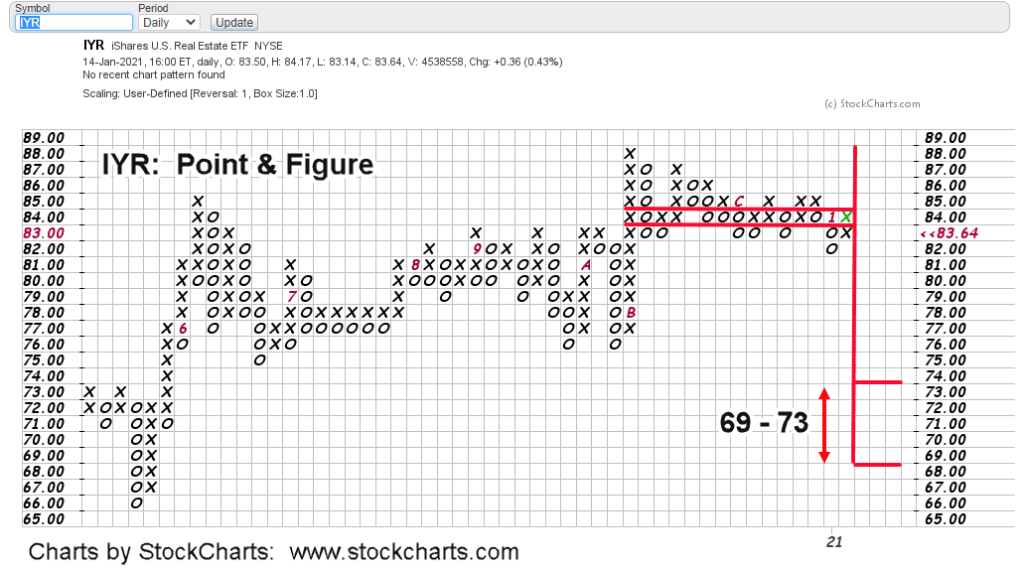
You don’t hear about Pont & Figure anymore. P&F looks old, stodgy and boring; but that’s exactly how one should approach the markets to be consistently profitable.
‘Trading is an old man’s game; you need to have a good, long memory.’
Well, the author of these updates is certainly old … well into his sixties and with a long memory; The crash of ’87, debt wipeout of ’98, tech bubble crash of 2000, the 2008 meltdown and now, today.
Those advanced years tempers one’s desire to constantly jump in and out on the swings. Not to say that might need to be the method at the time; but like Van Metre’s approach, the big money’s in the big move.
The jobs data released yesterday basically tells us ‘The economy ain’t coming back’ … possibly ever, in our lifetimes.
We’re at an order of magnitude greater than 1929; it was thirty years before that market returned to its prior levels.
Which brings us back to real estate and IYR. The P&F chart shows us, if there’s a breakout to the downside, initial projection of the move is to support around 69 – 73.
Keep in mind that if (or as) price action passes down through the low 80’s, it then builds up another area of congestion projecting even lower. The initial breakdown would only be the start of downside potential.
With that in mind, the firm is in position (not advice, not a recommendation) using DRV as the trade vehicle. Stop level is in the vicinity of yesterday’s DRV low @ 10.38.
Note: Posts on this site are for education purposes only. They provide one firm’s insight on the markets. Not investment advice. See additional disclaimer here.
The clip below is the last 20-minutes of IYR going into the close. It’s less than a minute long, so the trade action has been sped up.
There are several important parts.
First, there’s a Fibonacci retrace tool being used that has top origins off the view of the chart.
The dashed line at the top of screen is the 38.2% retrace of the entire move over the past two months.
It’s clear IYR has tested and pulled back from this area.
Next we see to the far left price action topping around 83.75. Following that line to the right, in the middle of today’s session is a small triangular wedge that’s six-candles wide (approx: 90-minutes).
As the recording starts, price action has come back to that (83.75) area. It can either bounce off to the upside or break down.
A breakdown indicates support is weak; we may have seen the end of the counter-trend move discussed in the mid-day update.
As noted, price action broke through minor support and closed below. We’ll see what happens next.
For the day, IYR tested and pulled back from the 38.2% retrace area; suggesting it’s ready to continue subdividing lower.
TC2000 Charts courtesy of Worden Brothers, Inc. www.worden.com
Note: Posts on this site are for education purposes only. They provide one firm’s insight on the markets. Not investment advice. See additional disclaimer here.
It’s just after 11:00 a.m. EST; typically the time markets end their counter-trend action and reverse.
Yesterday saw the firm’s exit of DRV positions in anticipation of higher action (lower in DRV). That’s what we’re getting now; except IYR is hitting and testing the underside of established resistance.
The DRV positions have been re-opened; not advice, not a recommendation.
If this test is going to hold and IYR reverses lower from here, look for price action to stall during the day or even now, just after 11:00a.m. EST.
Well traded inverse funds for IYR, are SRS (2X inverse) and DRV (3X inverse).
Recall that conditions are in place for a general market top and reversal; bonds, dollar have already reversed higher. Gold (inflation proxy) is continuing lower.
The entire setup along with the insane unemployment claims from this morning, suggest when the market heads lower, the move will stun even those who are ready on the short-side.
Note: Posts on this site are for education purposes only. They provide one firm’s insight on the markets. Not investment advice. See additional disclaimer here.
Note: Posts on this site are for education purposes only. They provide one firm’s insight on the markets. Not investment advice. See additional disclaimer here.
Note: Posts on this site are for education purposes only. They provide one firm’s insight on the markets. Not investment advice. See additional disclaimer here.