The entire precious metals sector may be about to take an unexpected hit.
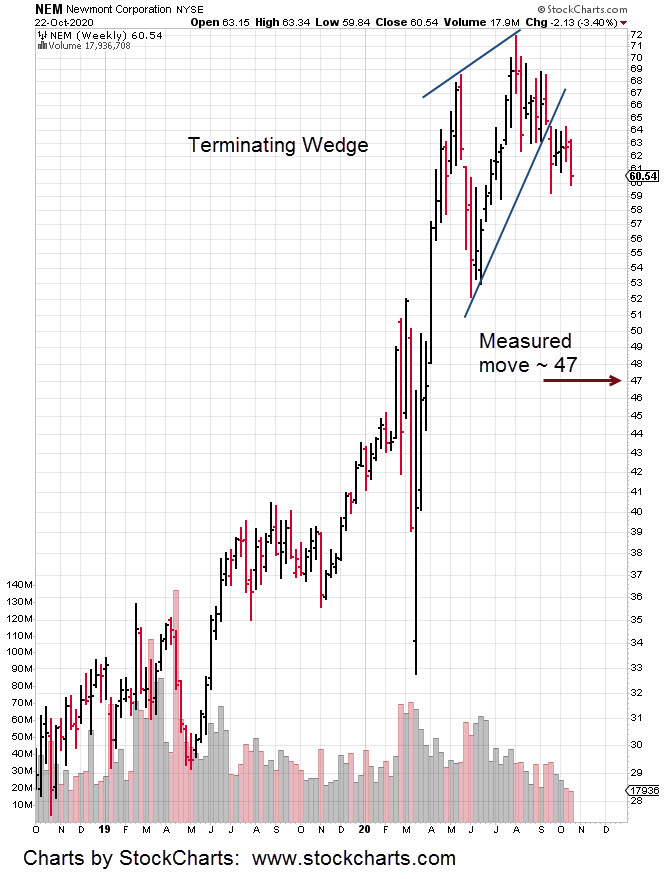
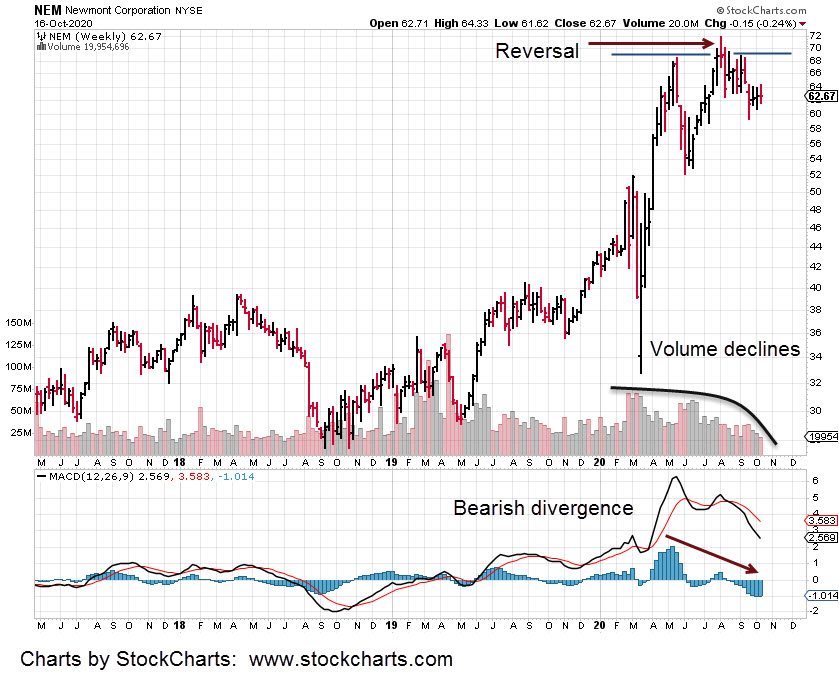
Prior updates have discussed the Newmont (NEM) bearish divergence and reversal. This update shows a rising wedge breakout to the downside.
Using standard analysis techniques on the chart below, we get a measured move to the vicinity of 47 for NEM.
A decline of that magnitude, a drop of over 22%, may be the catalyst for a whole other bearish scenario.
Just based on empirical observation and analysis generally available (YouTube, et al), it’s pretty safe to say that no-one is prepared for a significant decline.
Well, almost no-one. As reported back in late September, the only YouTube analyst (that was located) proposing the idea of a decline was Sajad, in this report.
Note: Posts on this site are for education purposes only. They provide one firm’s insight on the markets. Not investment advice. See additional disclaimer here.
Note: Posts on this site are for education purposes only. They provide one firm’s insight on the markets. Not investment advice. See additional disclaimer here.
Let’s walk through the junior gold miner’s index (GDXJ), reversal one step at a time.
The following discussion refers to the five number points on the daily chart below.
Before we start … the stage was already set over the weekend with the ‘Newmont’ update. We showed that it’s in reversal.
The junior index (GDXJ) does not look obvious at this point. In the markets things (usually) never look clear-cut at the exact inflection point.
Let’s begin:
First, the gold miners have been in an uptrend along with the rest of the markets since the recent bottom in March of this year.
Data Point No. 1
Price action penetrates deep below established support with the second largest down volume shown on the chart. This can be interpreted as either a shake-out or the beginning of distribution.
The next day has a reversal bar that closes right at the support level. Volume is heavy, but not as heavy as the prior down session.
The day after that, the inside day, is the first indication that something’s wrong. If this index is really in a screaming bull market it’s not going to allow anyone to get aboard comfortably.
The following days show price action laboring to move higher until the next down-thrust.
Data Point No. 2
The down thrust pushed just below the support level shown and closed lower. Again, the next day is a tight range inside day … instead of a sharp move higher.
This action is more indication there’s not enough demand to push prices immediately higher.
Note: When price action penetrates support, it sets up what’s called a Wyckoff ‘spring condition’. It’s a market set-up where prices are expected to rise dramatically.
Instead of dramatic, it took four trading days for GDXJ to rise into the next data point.
Data Point No. 3
We’re at previous resistance and we can see price action stall. It then retraces back to the 57-area (black dashed line), and made another attempt at an upside breakout.
That attempt only lasts one day before we begin a decline into the next data point
Data Point No. 4
Price action pushes below the previous minor support at the 57-area and forms a reversal bar … which was yesterday. That brings us to today.
Data Point No. 5
Another attempt to breakout higher results in what looks like at this point, a failed attempt.
This is the danger point.
Price action closed off the high of the day. This indicates there’s not enough demand to keep the close at higher levels.
It’s at this location, a short position was opened (not advice, not a recommendation) via JDST with a stop near the day’s low (for JDST).
It’s a tight stop.
The expectation is for price action in GDXJ to decline from these levels.
We’ve shown how there is not enough demand to drive price higher. The cacophony of so called hyper-inflation ‘experts’, is all part of the picture.
If everyone’s long silver/gold miners … who’s left to buy?
Note: Posts on this site are for education purposes only. They provide one firm’s insight on the markets. Not investment advice. See additional disclaimer here.
When in an uptrend and prices start to flag, it’s a warning that energy is lost.
The Newmont update showed the heavy hitter was in a reversal. That update gave specifics on how or when the reversal would be negated (and back into an uptrend).
It’s not happening. The upside hasn’t showed … or, at least not yet.
The next trading day, Newmont (NEM) lost 1.5%. The day after that (yesterday), was another down day with a loss of nearly 1%.
Today, NEM is attempting to move higher. However, the weekly bar is still in reversal.
The mining indexes themselves are not so clear. The junior index with its weekly chart below, has it reversing last week and now attempting to move higher.
It’s losing steam. It’s no secret that failed moves can be the most dynamic of all price action.
The market is ‘supposed’ to go one way … in the case of the silver/gold miner’s, they’re supposed to be moving higher; Hyperinflation and everything, right?
What if everyone’s on the wrong side of the trade?
What if the expected hyperinflation is years away?
This juncture right now, appears (not advice, not a recommendation) to be a low risk area to go short.
In the case of the junior index GDXJ, if price action closes up for the week, the bull market may continue.
If not, and GDXJ closes down for the week, the up-trend looks like it’s failing and the entire sector could fall apart.
Note: Posts on this site are for education purposes only. They provide one firm’s insight on the markets. Not investment advice. See additional disclaimer here.
Note: Posts on this site are for education purposes only. They provide one firm’s insight on the markets. Not investment advice. See additional disclaimer here.
That’s exactly what’s happening with biotech (IBB) and more specifically Amgen (AMGN).
Just like with Newmont and GDX from the previous update, Amgen’s the heavy hitter for the biotech sector.
What we see on the daily chart below and expandable version here, is that AMGN’s at the danger point.
Price action penetrated well established support and then stopped dead (so far).
If that’s the case, we’re looking for price action to rebound and move toward the 242 – 244 area; a 50% retrace from current levels.
If that point is reached, depending on the behavior of price action itself, the expectation is for a long-term reversal.
There have been several trades using BIS and LABD with the overall result being about break-even to slightly down.
More important than outright profit is the trading insight (over several months) into the sector itself. That insight can only come from active positions.
No amount of ‘paper trading’ or external analysis will provide a visceral feel for the market.
Summary:
We’re waiting for price action in AMGN and the overall IBB, to counter-trend upward as we head into November.
If there’s an obvious reversal at that time (not advice, not a recommendation) the risk on a short position may be at its lowest.
Note: Posts on this site are for education purposes only. They provide one firm’s insight on the markets. Not investment advice. See additional disclaimer here.
Note: Posts on this site are for education purposes only. They provide one firm’s insight on the markets. Not investment advice. See additional disclaimer here.
The October 4th, update proposed a top and reversal for Biotech (IBB) at or near the election. November, 2nd , or 3rd, could be new highs followed by an immediate reversal.
Fibonacci week 34, from the 3/16/20 lows, is the week ending on Friday, November 6th.
The daily chart (below) has a trend that’s been confirmed; If it remains intact for the next three weeks, it will lead us straight to new highs at the beginning of November.
Following price action in this way allows for preparation.
Timing, position size and stop levels can be (and must be) planned in advance. Not a recommendation, not financial advice.
The topping formation in biotech has been followed and traded (via BIS and LABD) by this firm since early June.
Doing so, forces one to be accustomed to the behavior of the sector.
Behaviors such as counter trend action in IBB, tends to be complete and resume original trend, right around the 10:00 a.m. to 10:30 a.m. time-frame.
That’s a data nugget that can’t be obtained by parachuting into a sector, taking a position and hoping it all works out.
A perfect (short) trade set-up would be for price to gap-higher into the 2nd, or 3rd (November) and allow for an entry with a well defined stop … such as the top of the gap-bar.
Of course, at the open this Monday, IBB could break the trend-line and create an alternate scenario … anything can happen.
However, at this point, probabilities and momentum (although waning) favor continuation upward.
Note: Posts on this site are for education purposes only. They provide one firm’s insight on the markets. Not investment advice. See additional disclaimer here.
The original entry from the last session is well in the green; the trade has been increased by 50%.
‘Pyramiding’ is a classic time-tested method for market speculation. Wyckoff discussed this technique in his first publication of “The Ticker”, back in 1907.
That specific (first edition, 1907) text can be found here. Scroll to pages 17 – 18, for “Rules of a Successful Speculator”.
Continuing on with nat-gas, as of this post (12:58 p.m., EST), the futures NGX20 is right at resistance in the 2.800 area. This corresponds to roughly UNG @ 12.45.
We’ll see if it pushes through to the upside. If not, then we can expect some kind of downward test at the next session, tomorrow.
At this point with NGX20 trading at approximately 2.795, it looks like it can go a little higher before it hits a limit-up for the day.
Barring some unforeseen event that could cause nat-gas prices to collapse, a position is now open that will allow participation in an expected price rise going into the fall and winter months.
Potential exit targets have been established as identified in this report, here.
Note: Posts on this site are for education purposes only. They provide one firm’s insight on the markets. Not investment advice. See additional disclaimer here.
It was a vicious wipe-out in today’s session with nat-gas, UNG and futures down sharply.
Let’s summarize the recent action leading up to today:
Late Sunday evening:
Nat-gas pushed past upside resistance (in the overnight futures market) on Sunday, the 11th.
Once past resistance, price action stalled. That’s a warning sign a reversal is imminent.
Early Monday morning:
By the time we got to the regular open on Monday, nat-gas was already in a reversal condition.
Correspondingly, price action in UNG declined throughout the day and closed lower.
Tuesday, all day
Yesterday was an upward test of the reversal that failed to post a new daily high.
Price closed lower and the stage is set.
Tuesday, overnight to Wednesday
At the open last night, the futures declined immediately and traded down about -5% to -5.5%, in the area equivalent to UNG ~ 12.04.
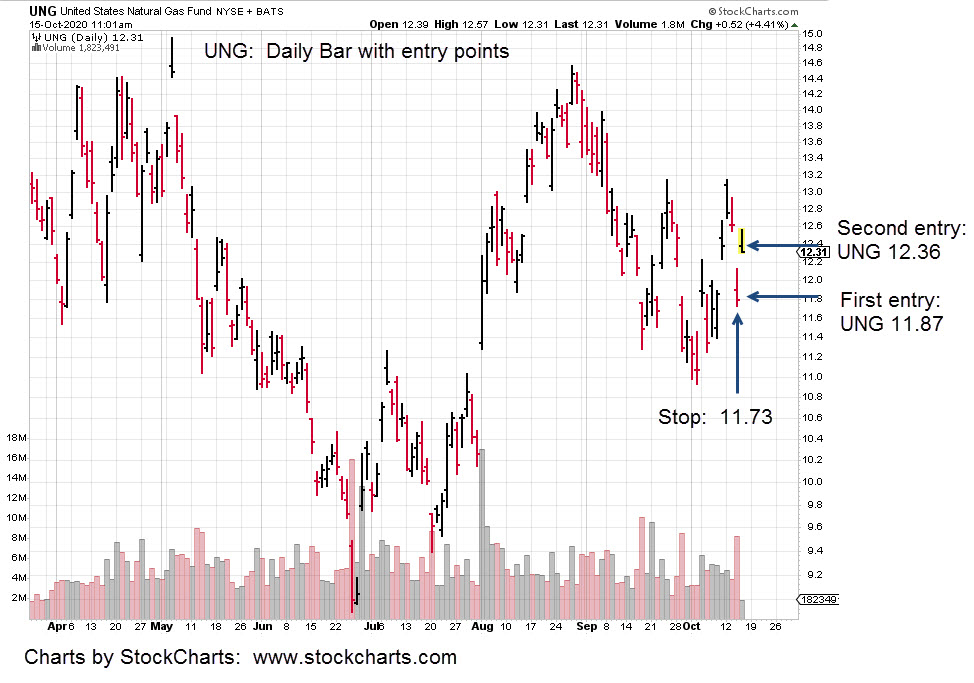
This morning opened even lower (UNG: 11.91) and then attempted to rally. It looked like UNG was going to make higher it until later in the session when things fell apart. UNG washed out and closed lower.
So, what does it all mean?
Working with a commodity tracking fund like UNG, means you have to track the actual commodity. In this case that would be the current front month futures contract NGX20.
Looking at the price action of the futures, we see that during today’s wipe-out, towards the close, NGX20 bounced off well established support at the 2.600-area.
It was at this juncture where a long position was opened; as price was declining at the end of the day: UNG @ 11.87, with a stop in the vicinity of 11.74-ish.
Wednesday overnight session
As of this post, 9:56 p.m. EST, NGX20 opened higher and is drifting higher. This is expected if the bounce off support scenario is valid.
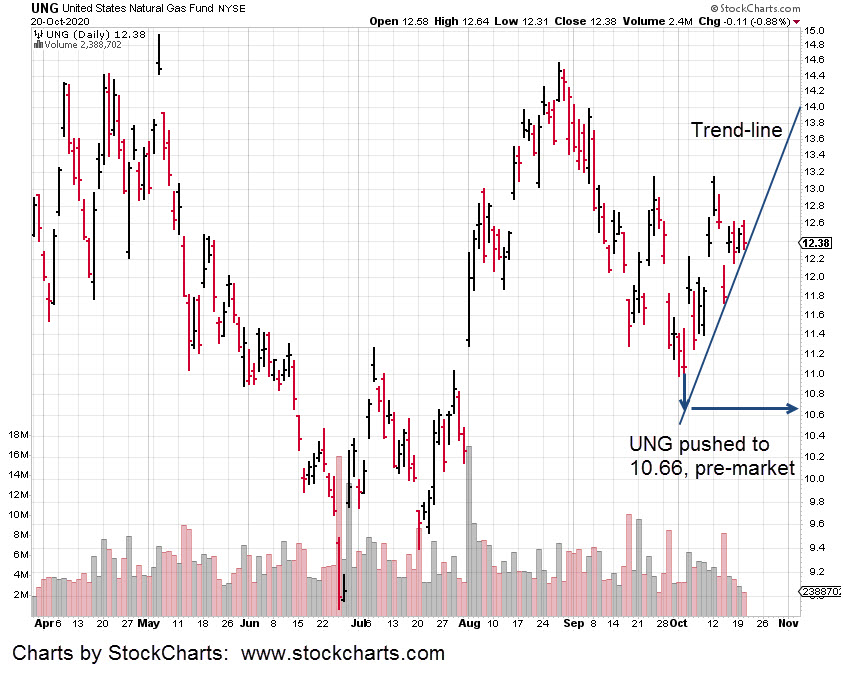
The weekly chart (below) of UNG shows that risk has been nearly removed … never completely, but a close as one can reason.
The expectation for tomorrow, Thursday, is continued action higher and out of the danger point.
What’s in the EIA report is likely immaterial. Sure, it provides an excuse for price to move. However, probabilities are already set for continued upside.
UNG is at the danger point. Price action can go either way. If it continues lower after the EIA report, then we have probability of making new lows for the winter.
New lows seem unlikely going in to fall/winter but anything can happen.
Note: Posts on this site are for education purposes only. They provide one firm’s insight on the markets. Not investment advice. See additional disclaimer here.