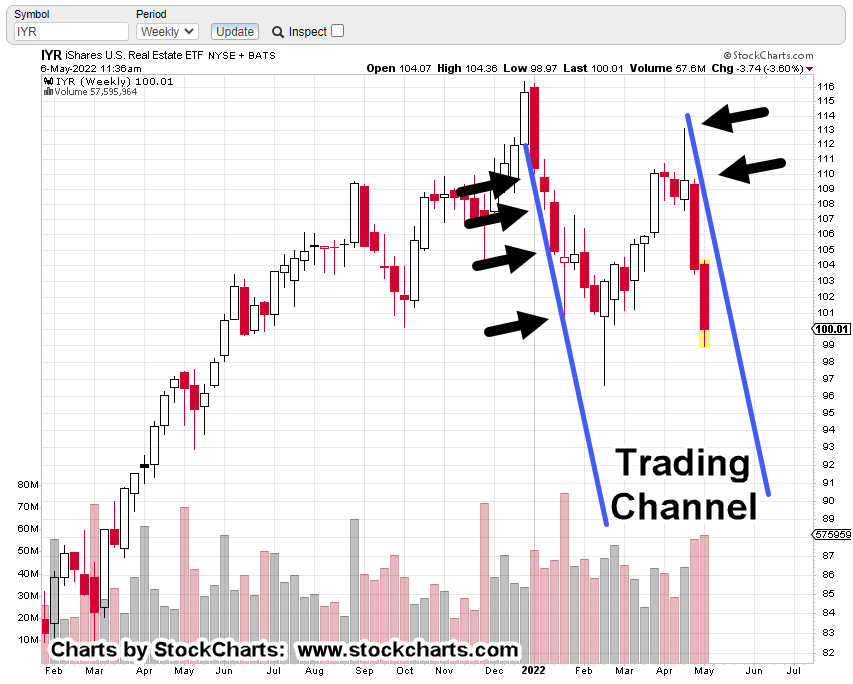
Real estate’s IYR, is trading in a channel that’s declining at around -94%, annualized.
The channel was identified and first presented, in this post.
Let’s take a look at how things are going thus far.
Real Estate IYR, Weekly Chart
The chart below, is a close-in view of current action.
The black arrows are ‘hits’ on the channel lines, providing confirmation of its existence.
From the lower-most channel line hit on the left side (the ‘demand’ side) to the first channel hit on the right side (the ‘supply’ side) is a Fibonacci 13-Weeks; adding more confirmation to the channel’s validity.
The next chart pulls out and extends the channel to show the potential of the move.
The ‘Damand’ Location identifies the point at which price action would need to decline (at this juncture) to contact significant demand if this channel is in-effect.
That is, if the channel has been identified properly. If so, it’s a long … long way down.
Summary
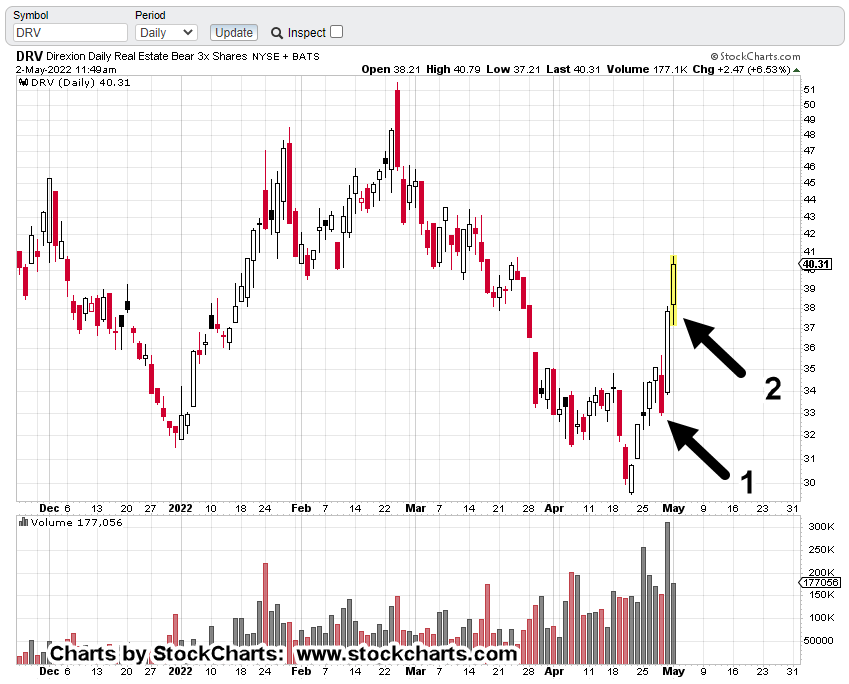
Currently maintaining short with trade DRV-22-02 (not advice, not a recommendation).
The stop location has been moved to DRV 37.80 and is most likely going to be moved higher depending on the close of the day.
Note: Posts on this site are for education purposes only. They provide one firm’s insight on the markets. Not investment advice. See additional disclaimer here.
The number of opinions forecasts, pontifications and gesticulations have reached levels beyond the absurd.
Everybody’s important and has some intellectual and/or philosophical missive to promulgate.
We have great levels of insight like the selected items below. As promised, these comments were taken from the article linked in the last post.
“I don’t need to pay some 78 year old to hold 1/2 my money in cash”
“What a joke. We’re heading for multi-year blow-off top”
“78 year old fund manager loses his azz … markets going nowhere but up”
“Parabolic increase to nosebleed levels and an epic explosion 3 years from now.”
Seems our idiot/lazy Boomers, Gen-X-rs, Millennials, Gen-Z-rs, and just about everybody else, is the genius in the room; except for the 78-year-old.
He’s just a buffoon.
If someone has no real skill, experience or initiative, they resort to trash-talk like we see above.
Getting the right experience is the hard part.
Having experience in the markets involves many years of education (i.e. losses).
Just for documentation’s sake, let’s take a look at two examples of what experience looks like; each in their own respective industries.
Exhibit A:
Go ahead, check out this Bubba from Amarillo, Texas.
His customers drive from neighboring states, hundreds, if not thousands of miles away to have him rebuild their transmissions.
Within the first 5-minutes of the video above, there’s probably 30-years of experience on display.
I would suspect his rebuilds go for top-dollar; rightly so.
Then, we have this:
Exhibit B:
Yesterday’s market action, and today’s, has happened before.
That is:
A sharp multi percentage point, headline grabbing spike higher (within a down market), that’s immediately reversed the very next day.
Not only that, but the reversal also signified a bear market had started in earnest.
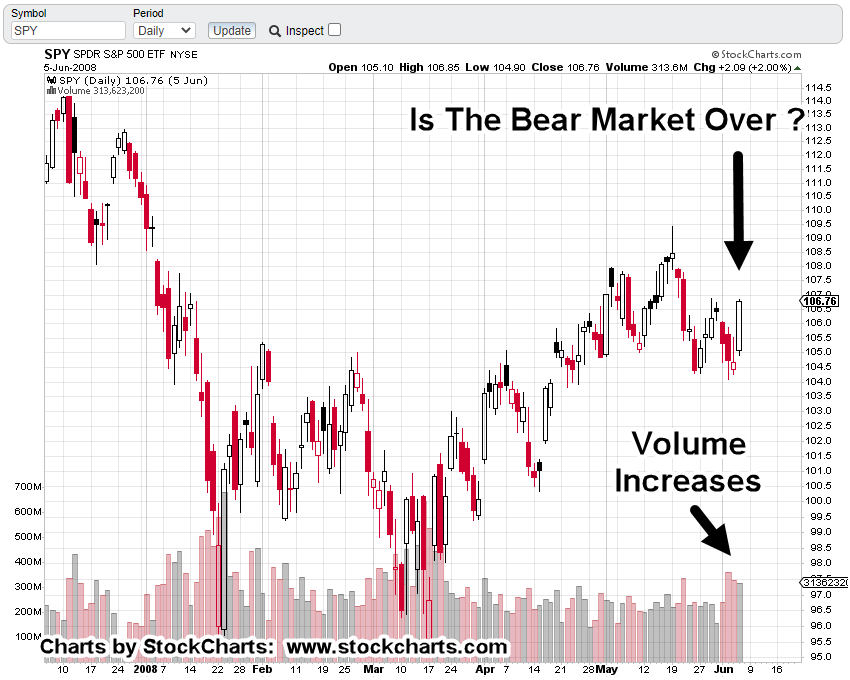
S&P 500, SPY, Daily Chart
Let’s set the stage.
In our example, the S&P had already topped and reversed.
It spent the next seven months heading lower and then retracing upward to an eventual downside reversal.
The next leg down continued, but then a few days later, there’s a massive, headline grabbing, upward spike.
Is the bear market over?
Is this the signal to buy the dip like our ‘experts’ above think for the current situation?
The next day, price action reversed the entire gain (like it has done today).
The chart shows the result.
From a personal standpoint, a 78-year old that’s still mentally sharp enough to provide his services and is not an obvious (globalist) sell-out the likes of which are on CNBC, then I’m very keen on what he would have to say.
His message: It’s the biggest bear market of his life.
Secondly, as Dr. Elder has said, ‘Trading is an old man’s game’. A good memory is critical to creating an edge.
In our example, I remember that upward spike well.
It was a Thursday.
The next day, price action reversed hard to the downside.
It never looked back for nine months.
Summary:
Is the S&P scenario described above, where we are now?
History never repeats itself exactly.
However, one can propose with some level of confidence, if today was the kickoff to the next leg, it has potential to be the fastest, farthest down price action in market history (not advice, not a recommendation).
Note: Posts on this site are for education purposes only. They provide one firm’s insight on the markets. Not investment advice. See additional disclaimer here.
There were so many comments on the ZeroHedge article (linked here) about the musings of a 78-year-old money manager (effectively saying he’s an idiot … a dolt), we’re going to use those comments for reference on a go-forward basis.
Everybody has an opinion but nobody’s actually looking at what the market is saying about itself.
That’s where the answers will be found … no matter one’s personal bias.
Looking at real estate IYR, we see that price attempted to get above the axis line shown but did not make it.
Before we go further, a correction: The last post said the stop on DRV-22-02 was located at DRV 32.71.
The stop is actually located at DRV 37.21. Numbers got swapped.
Real Estate IYR, Daily
It’s interesting to note, ProLogis (PLD), the largest cap in the sector did not close higher for the session.
If IYR, with other indices do not have a decisive follow-through (stopping out DRV-22-02, in the process) at tomorrow’s session, the Ponzi scheme’s in serious trouble.
As already stated, events may happen faster than anyone expects.
Summary
We’ll leave off with this just out from ice-age-farmer; linked here.
The collapse of the entire food supply has been building (sorry, in the planning stages) for years.
It’s intentional.
Does anyone think that ‘raising rates into weakness’ is not also intentional?
Note: Posts on this site are for education purposes only. They provide one firm’s insight on the markets. Not investment advice. See additional disclaimer here.
For real estate IYR, the waiting part’s, already over.
This post back on April 27th, identified the trade set-up.
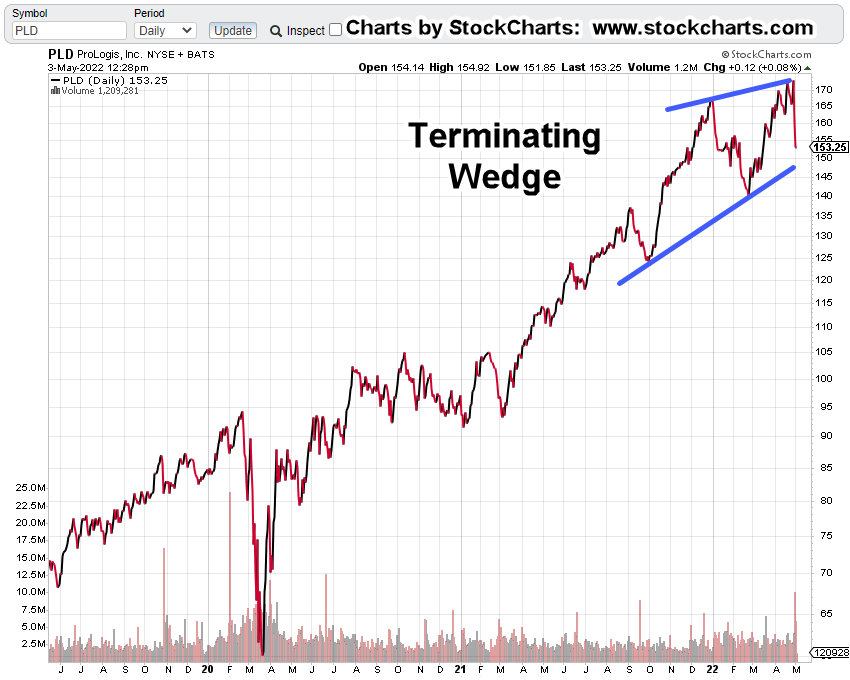
The prior all-time highs analysis for IYR, failed with an up-thrust reversal.
That told us, downside forces were in control.
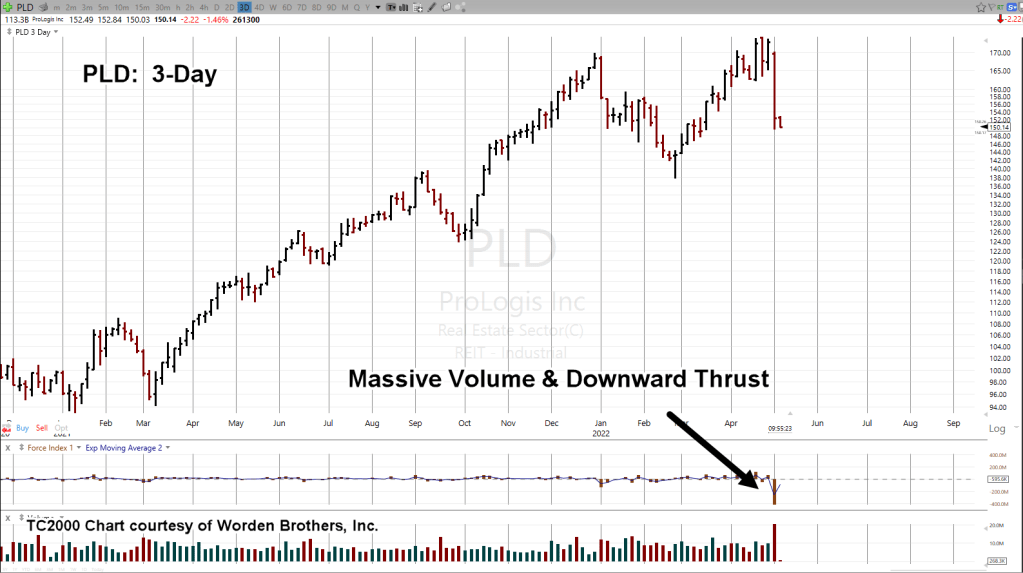
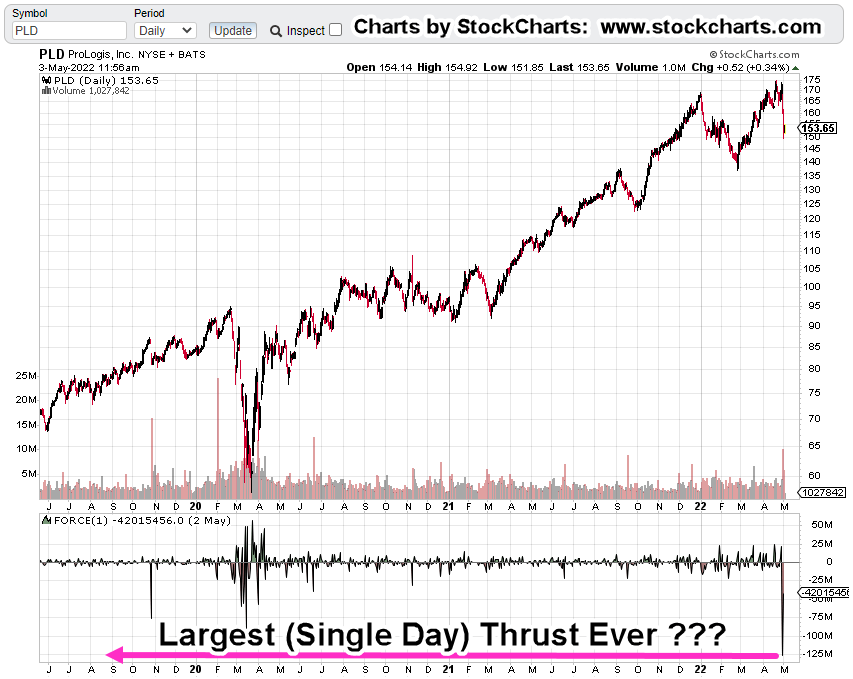
Adding to that, we had the largest cap equity in the sector ProLogis (PLD), showing a massive downward thrust lower; possibly the largest one-day event, ever.
Now, there’s more.
The two charts below are in 3-Day increments. As of this morning, we’re in a new three-day period.
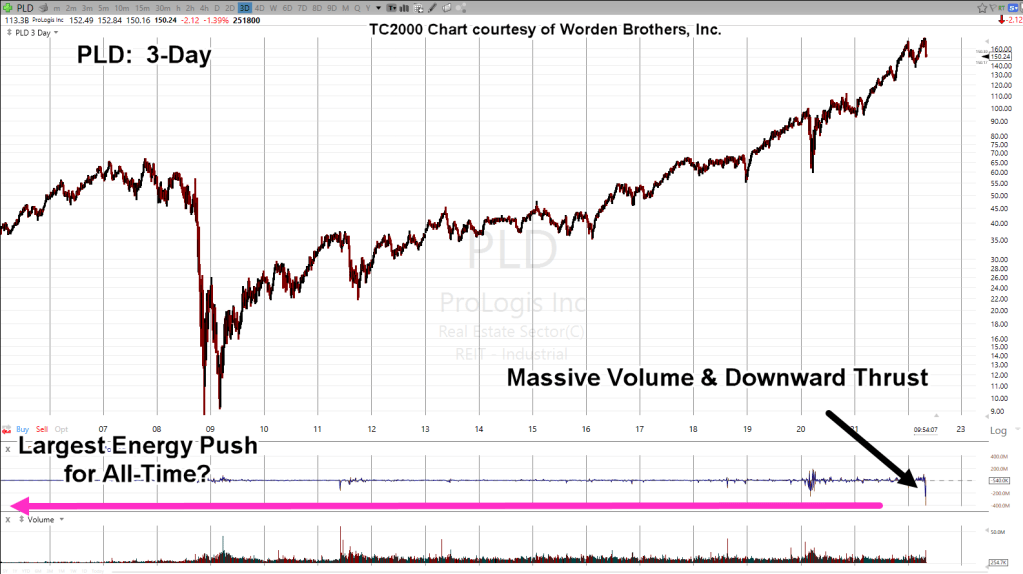
For three-days just ended, down-thrust energy for PLD, posted levels not seen since before February of 2005 !
Not even the wipe-out during the Financial Crisis of 2008, generated a similar 3-Day period.
What that means for PLD, at least, it’s in a territory of its own … literally off the chart.
ProLogis PLD, 3-Day
Compressing the chart to put it in perspective. The data below, goes all the way back to February 4th, of 2005.
The Fed-Man Cometh
All of that does not mean real estate can’t rebound higher after 2:00 p.m., EST (11:32 a.m. EST, as of this post).
Anything can happen.
The stop for the short position via DRV (DRV-22-02) is currently set at DRV 32.71 (not advice, not a recommendation).
Summary
At the open, IYR was lower and has continued lower but has not posted a new daily low.
That leaves the door open to the upside if there’s enough perceived ‘relief’ from any Fed comments.
The main objective of this post is to put forth the possibility, events may happen faster than anyone expects.
If there’s any kind of rally, it’s likely to be brief.
Note: Posts on this site are for education purposes only. They provide one firm’s insight on the markets. Not investment advice. See additional disclaimer here.
Note: Posts on this site are for education purposes only. They provide one firm’s insight on the markets. Not investment advice. See additional disclaimer here.
Note: Posts on this site are for education purposes only. They provide one firm’s insight on the markets. Not investment advice. See additional disclaimer here.
It’s about an hour before the Sunday futures open and gold (GLD), is in spring position; set to move higher.
The daily chart of GLD below, shows the action for the past three years. The chart following gets closer in to identify the set-up.
Gold (GLD), Daily Chart
Closer in with the spring set-up marked.
We know that empirically, if a spring set-up is viable and in-effect, it has a tendency to go straight into an up-thrust.
The chart below locates a potential up-thrust zone should the price action launch into a spring.
If gold breaks to the upside, be prepared for another round of bull mania hysteria … all the while, the structure of the overall markets continues to fall-away.
Note: Posts on this site are for education purposes only. They provide one firm’s insight on the markets. Not investment advice. See additional disclaimer here.