Note: Posts on this site are for education purposes only. They provide one firm’s insight on the markets. Not investment advice. See additional disclaimer here.
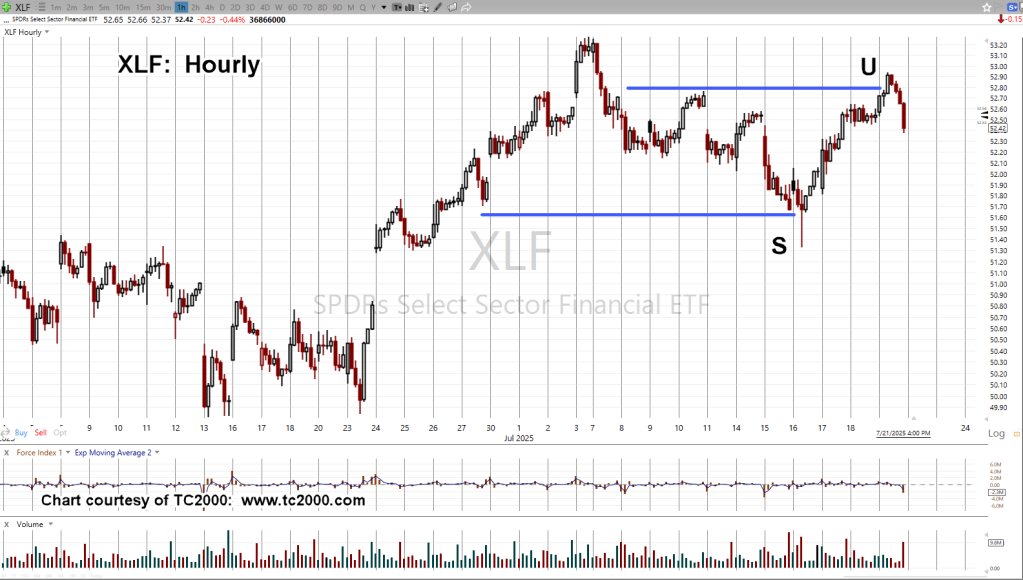
What we do know, price action posted a new high as outlined in the last update, link here.
At this point (11:50 a.m., EST), we’ve retreated from that high and are congesting at lower levels. So far, so good, for a short (not advice, not a recommendation).
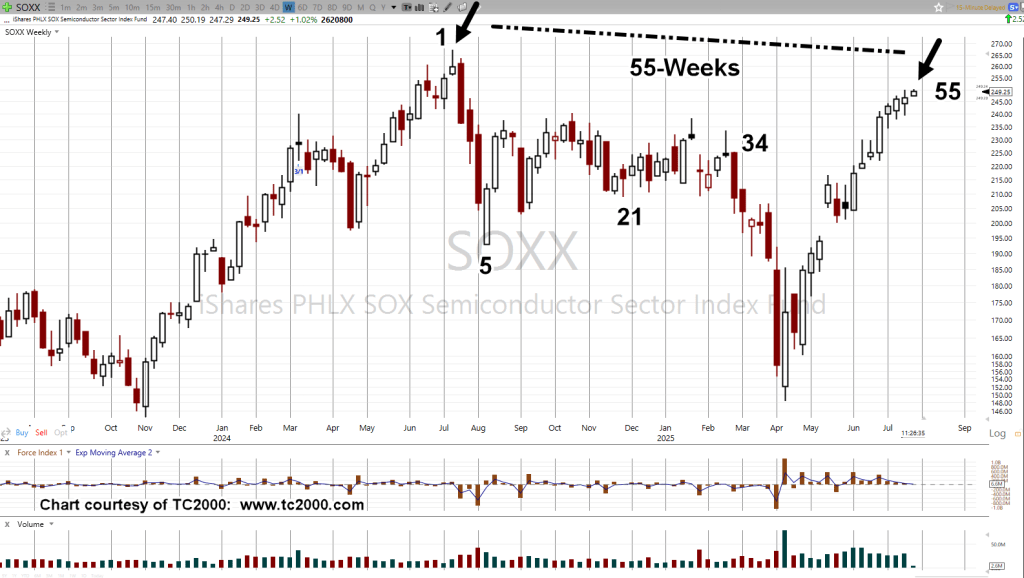
We also know, shown on the weekly chart, we’re at Fibonacci Week 55, from the all-time highs.
Semiconductors SOXX, Weekly
The SOXX penetrated highs of July 15th, as forecast.
We’re in Up-Thrust position after having completed a potential spring-to-up-thrust, set-up.
Positioned short, SOXX-25-07, with a very tight stop at (or to be) the session high (not advice, not a recommendation).
Note: Posts on this site are for education purposes only. They provide one firm’s insight on the markets. Not investment advice. See additional disclaimer here.
Similar to yesterday’s update, showing a wedge pattern for CRWD, we have another (long term) wedge pattern in Agnico Eagle Mines (AEM).
Focusing on ‘strategy’, when market patterns show up, especially in the longer timeframes, we’ll take notice.
Before getting to the chart, here’s a compilation of Richie Naso quotes and insights that have been reviewed over the past week. It’s always good to hear thoughts from a renowned trader.
Note: Posts on this site are for education purposes only. They provide one firm’s insight on the markets. Not investment advice. See additional disclaimer here.
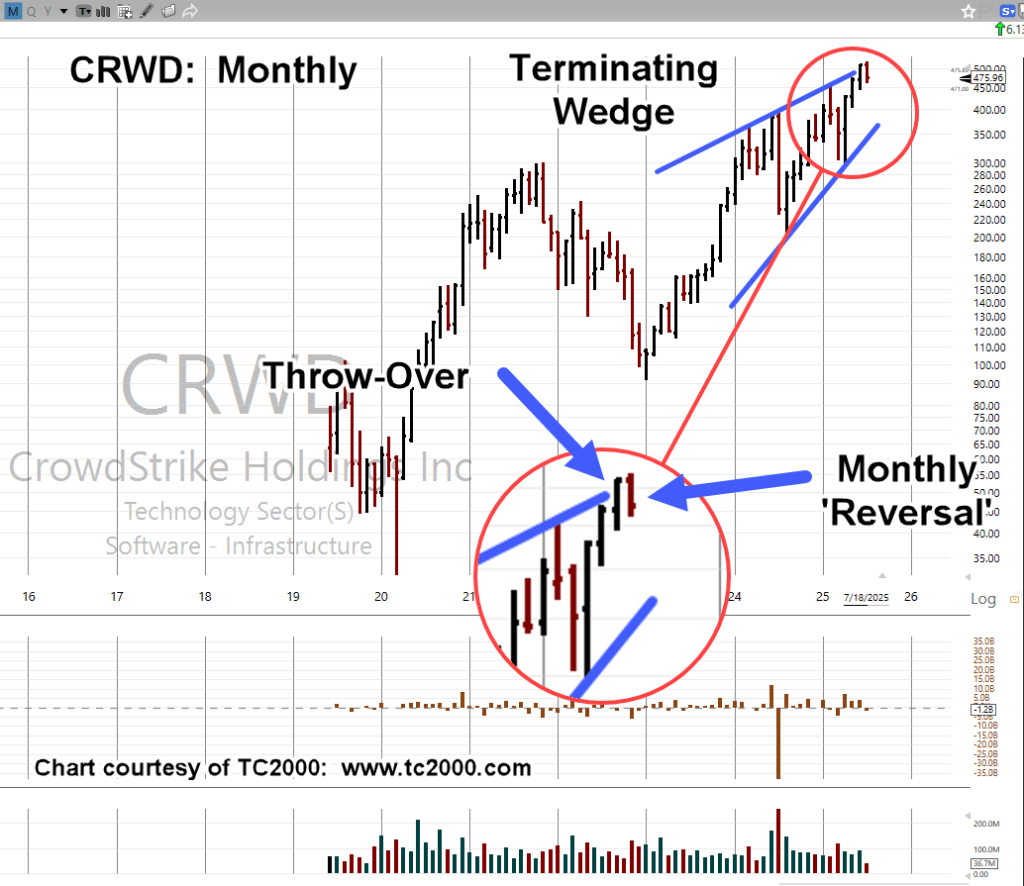
The insert at left, shows CrowdStrike (CRWD), on a monthly scale.
The month of June posted a ‘throw-over’ out of the terminating wedge pattern.
The month of July (so far) has posted a return back into that pattern.
The coming week may see an attempt to rally. If so and depending on price action, the risk on a short position may be reduced (not advice, not a recommendation).
Note: Posts on this site are for education purposes only. They provide one firm’s insight on the markets. Not investment advice. See additional disclaimer here.
Note: Posts on this site are for education purposes only. They provide one firm’s insight on the markets. Not investment advice. See additional disclaimer here.
Note: Posts on this site are for education purposes only. They provide one firm’s insight on the markets. Not investment advice. See additional disclaimer here.
Note: Posts on this site are for education purposes only. They provide one firm’s insight on the markets. Not investment advice. See additional disclaimer here.
Note: Posts on this site are for education purposes only. They provide one firm’s insight on the markets. Not investment advice. See additional disclaimer here.
Note: Posts on this site are for education purposes only. They provide one firm’s insight on the markets. Not investment advice. See additional disclaimer here.
There’s been plenty of coverage over the past week, about silver’s apparent ‘breakout’.
We may have a sustainable breakout, or there may be something else in the works.
As of this post, silver futures opened essentially unchanged, edging slightly higher (as of 7:04 p.m., EST).
With that said, we’ll look at the longer-term view of silver and specifically, the ETF tracking fund, SLV.
Silver SLV, Weekly
The smaller (magenta) wedge pattern at left of the chart, shows a sustained breakout.
That move culminated in the blow-off top, late April 2011.
From the initiation of the breakout (week of 8/27/10), to the first retrace was a Fibonacci 8-Weeks of higher highs, and higher closes.
There was a small amount of congestion for one month, in January 2011. Then, SLV continued on higher.
On a monthly scale, silver SLV, essentially went straight up for a Fibonacci 8-months with only one month lower, a total duration of 9-months.
You can almost see where this is going.
With the current ‘breakout’ (if we’re in one), the market may post an impulsive move, or alternate (from the prior wedge breakout) with some kind of choppy action.
As the chart implies, we’re at The Danger Point®, where price action’s hovering between a wedge pattern breakout, or throw-over.
Note: Posts on this site are for education purposes only. They provide one firm’s insight on the markets. Not investment advice. See additional disclaimer here.