It could be a slow grind, a series of ‘air-pockets’, or of course, not at all.
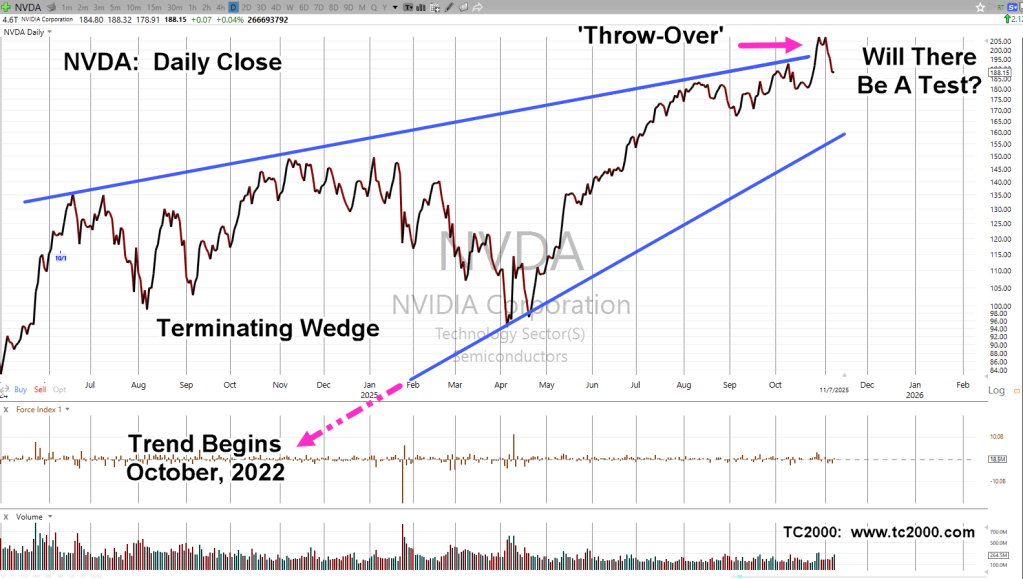
Using time-tested classical analysis, along with a dash of Elliott Wave, shows us we just had a terminating wedge ‘throw-over‘.
The video in the attached link, is brief and concise.
Throw-overs are (typically) major reversal indicators (not advice, not a recommendation).
As of yesterday, Friday, that’s where we are.
Nvidia NVDA, Daily Close
As seen with Nvidia, literally anything can happen. It could somehow recover, go sideways, or collapse.
If price action gets to the lower wedge, then breaks down, the ‘measured move’ for such a break, is -80%, to -90%, lower (not advice, not a recommendation).
Crash in The Past
The crash of 1899, shows us that just because we got past October without fanfare, a crash can happen at any time.
A prior update, written three-years ago, describes that crash, link here.
Note: Posts on this site are for education purposes only. They provide one firm’s insight on the markets. Not investment advice. See additional disclaimer here.
Lastly, using the way-back machine, here’s an article from the Seattle Times, written in December 1999. It compares the situation (then) to a century earlier.
On Track For Another?
Obviously, that can’t be known until if/when, it happens.
However, we can look at the most watched market, the S&P, and see what it says.
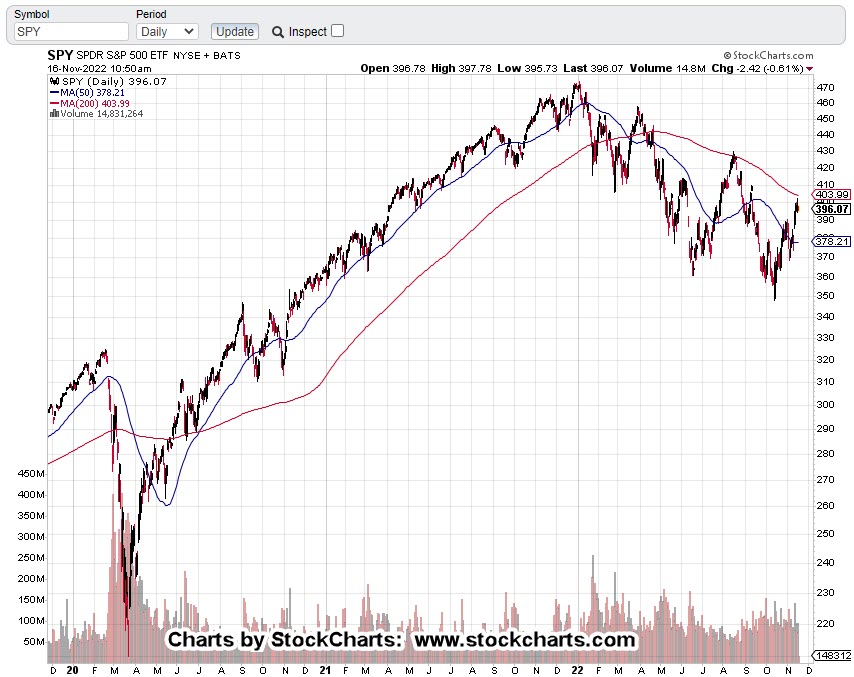
S&P 500, SPY, Daily
We’re leaving in the moving averages to show, at least from the 200-Day perspective, the downtrend is still intact.
Other items to note:
The market is still sub-dividing lower, lower highs, lower lows. Price action’s retraced to a Fibonacci 38% (shown below), and is also in Wyckoff up-thrust (reversal) position.
We’ll get closer-in with the details.
Moving averages have been removed for clarity.
The blue line is the resistance and up-thrust area. Price action clearly above and apparently, hesitating.
Dashed grey line is the Fibonacci 38% retrace from all-time highs (1/4/22), to the most recent lows set on 10/13/22.
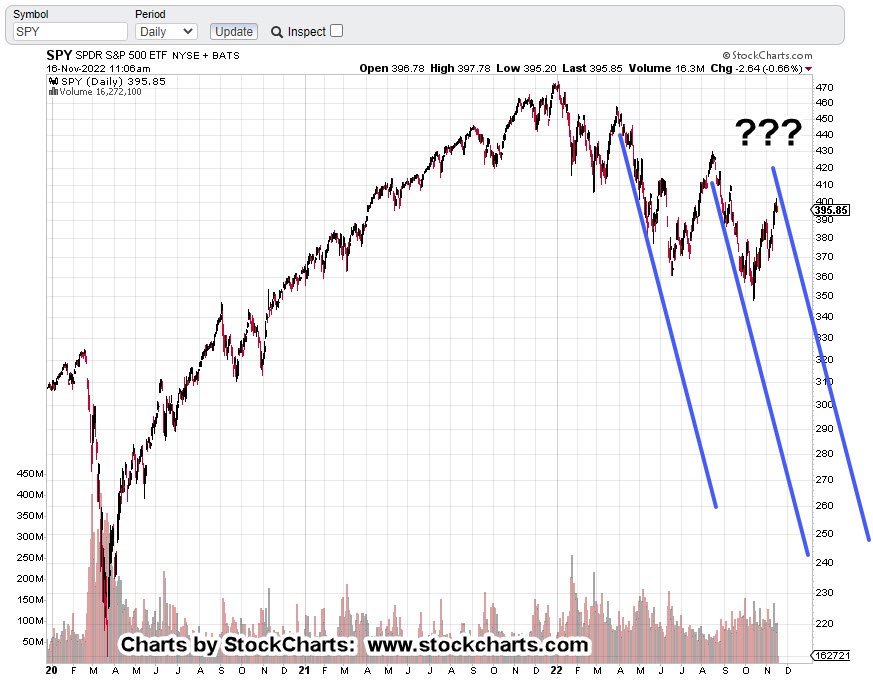
Zooming back out, is the scariest part of this chart.
There’s no doubt; we’ve had at least two repeating trendlines. A third could make it a trading channel.
Summary
As of this post (11:28 a.m., EST), SPY has yet to post a new daily low (below SPY, 394.49). If or when it does, that’s just one more addition to the bearish scenario.
Positions: (courtesy only, not advice).
The focus is on biotech; uniquely positioned as the weakest of all the major indices (not advice, not a recommendation).
Note: Posts on this site are for education purposes only. They provide one firm’s insight on the markets. Not investment advice. See additional disclaimer here.