You have to wonder; once the ruling oligarchs are finished with the first (‘speck’) round, moving on to the next fabricated crisis, if biotech’s not going to be thrown under the bus.
After all, its served its purpose.
According to comments posted beneath this article, about 33%, of the U.S. population have (apparently, voluntarily) injected themselves.
According to this link, it’s about 24%, of the population.
Either way, it’s a lot … in the tens of millions.
It’s a crazy business model; systematically destroy your customer base.
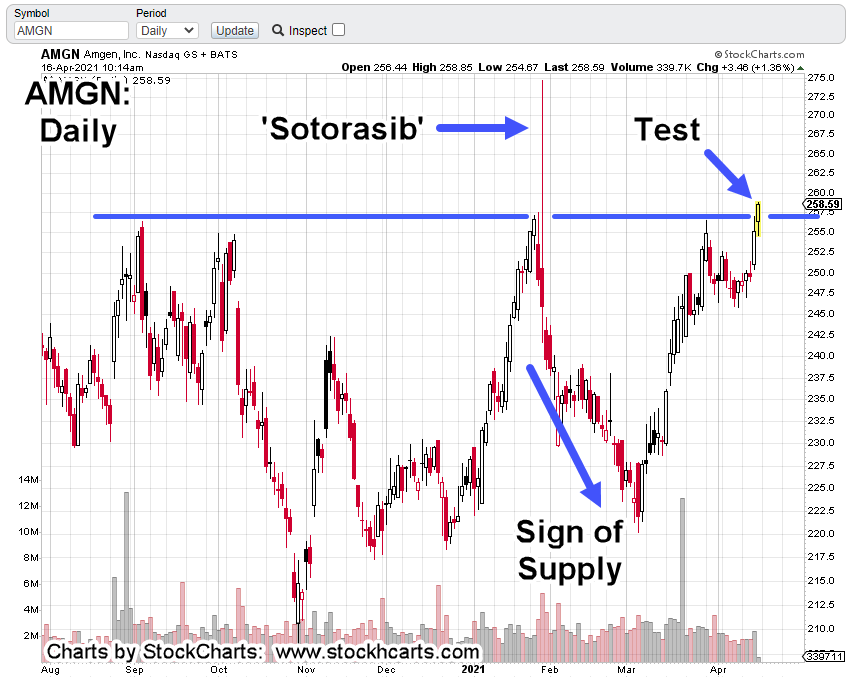
Said many times in these updates, attempting to match fundamentals to technicals is usually not successful.
Sector Analysis:
Referring back to Ed Seykota, in his ‘Market Wizards‘ interview, he said using fundamentals as a basis for positioning, rarely if ever, worked.
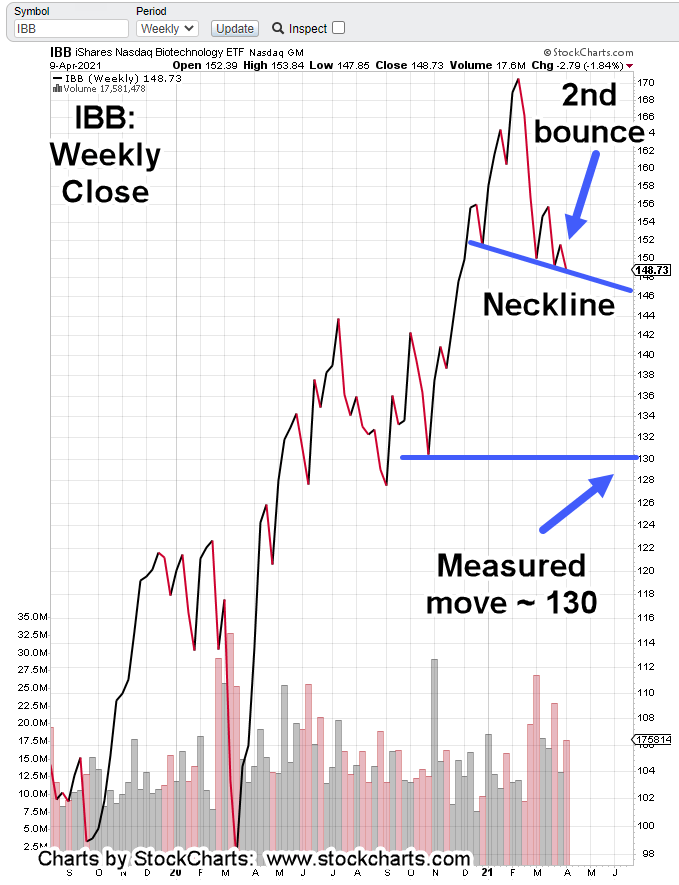
Still, it’s undeniable something very wrong is going on in the sector.
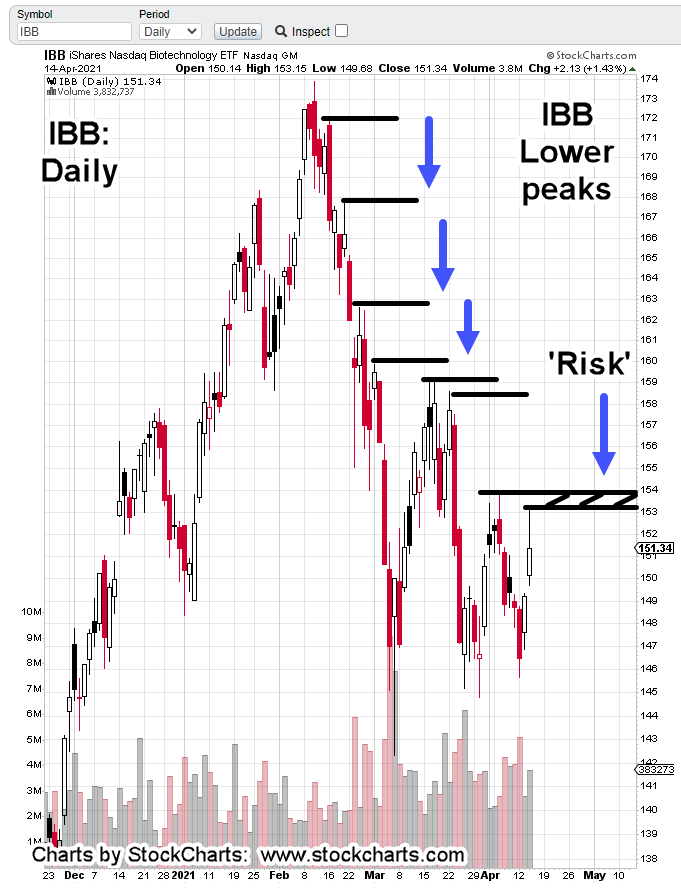
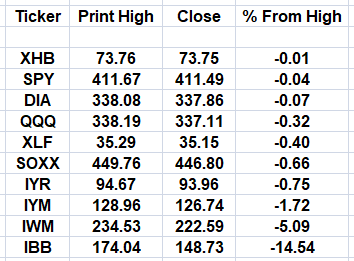
Our market table has been updated and we’ve included the S&P Biotech Sector, SPBIO:

All markets are within fractions of a percent of all time highs except for semis, mid-caps and biotech.
The S&P biotech is down a whopping, 25%.
It’s already well in bear market territory.
Positioning:
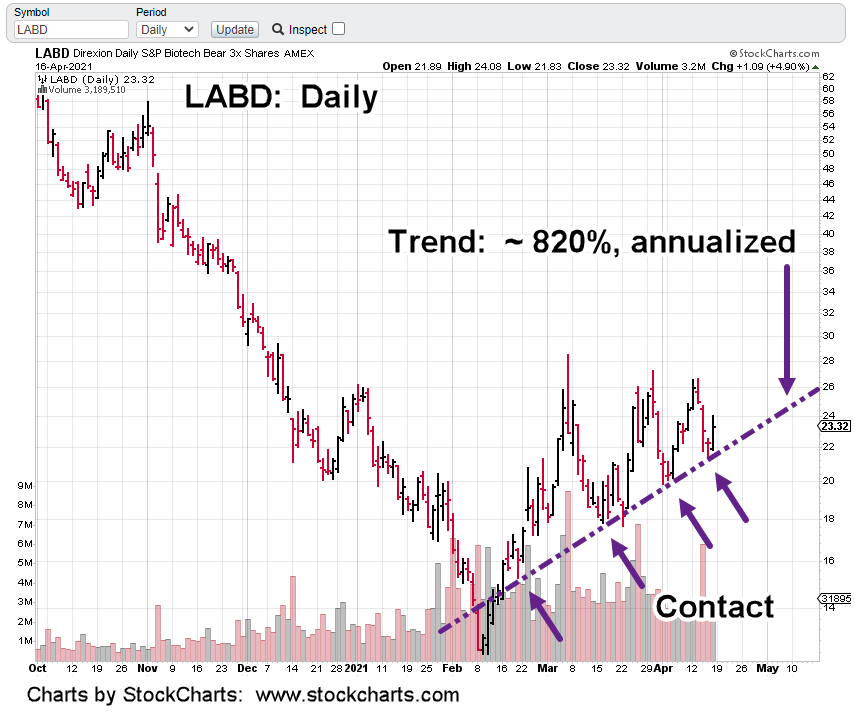
Since we’re working the short side (not advice, not a recommendation), the focus is on biotech and specifically LABD.
The fund attempts to track the 3X inverse of SPBIO.
With that kind of leverage, LABD has significant downside bias. Positioning (from experience) is best suited when the move is sustainable and persistent.
Looking at the chart of LABD, we could be there. At this time, the fund is trending higher at a stiff +820%, on an annualized basis.
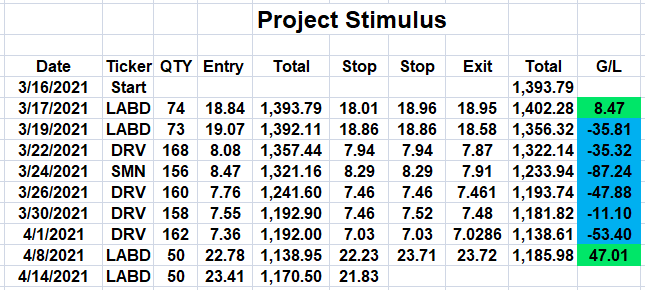
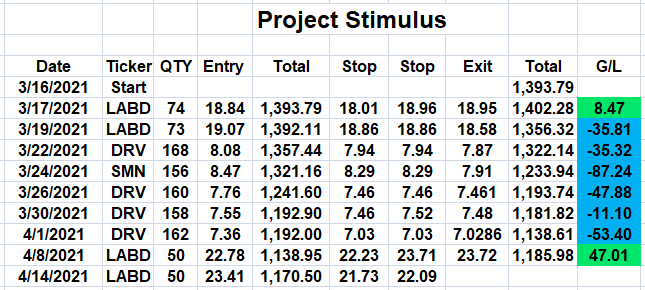
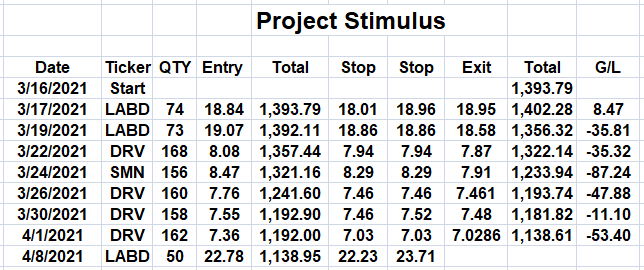
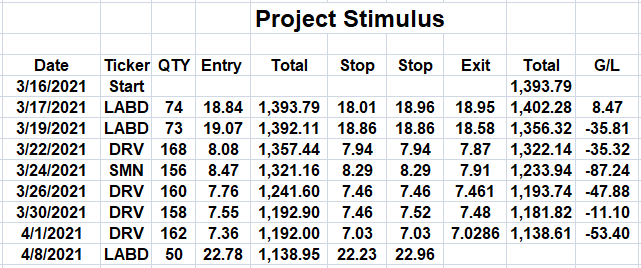
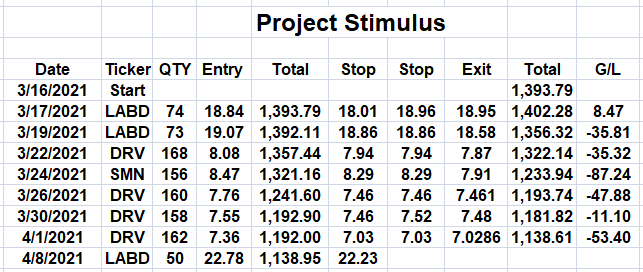
Project Stimulus:
Our Project account is positioned as shown. Since the account’s not large enough to enable leverage as determined by the broker, we just have to wait it out till it gets there (currently set at $2,000).

Summary:
Stated in The Rich And The Super Rich (if memory serves), not since Marie Antionette have the ruling oligarchs allowed themselves to be out in the open.
Seems like her demise cured them of having to get (direct) attention.
That would mean, people in the public eye at this point, are just useful idiots. And when their usefulness has run its course … ???
From watching them, it’s obvious they’re delusional … thinking they can tame evil (even harming children) and escape wrath.
“And for this cause God shall send them strong delusion, that they should believe a lie:”
The entire ‘transhumanism’ agenda is an attempt to cheat death … to avoid judgement … to outsmart the almighty.
Good luck with that.
Stay Tuned
Charts by StockCharts