The forecast chart has been annotated to show where price action is now.
Biotech (SPBIO), and inverse fund LABD, are in a deep test. A little deeper than expected … but not enough to invalidate the set-up.
As of this post, price action is near the support line that’s just below the “Test” label.
Of course, the expectation is for this test to hold and for LABD to reverse back higher into the dynamic move shown; not advice, not a recommendation.
Fundamentals:
It seems like each day provides new insight into the disaster that is biotech.
This just out:
If you have been injected, The Red Cross says your blood is not wanted; your antibodies have been destroyed.
Note: Posts on this site are for education purposes only. They provide one firm’s insight on the markets. Not investment advice. See additional disclaimer here.
First, the daily chart with the familiar trendlines
The magenta arrow shows, down-thrust has diverged. Today closed lower but thrust energy was (nearly) nonexistent.
The right side trend is still unknown.
More contact points are needed. However, inverse fund LABD has shown consistent trend angles (above) at various points throughout its sideways, corrective move.
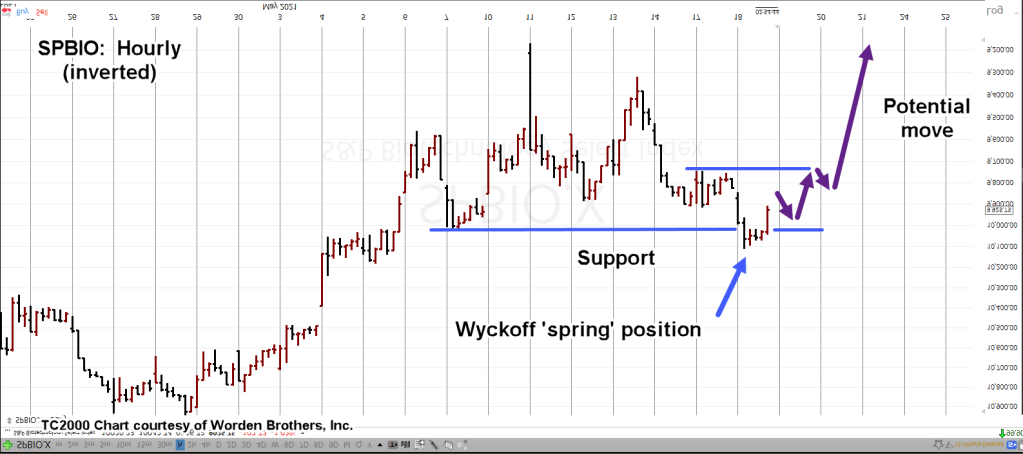
Taking the SPBIO hourly chart and inverting, gives a more accurate picture; we see the Wyckoff set-up:
This type of price action is high probability. Not perfect, but still potentially 75% – 80%, effective or higher.
The fact that inverse tracking fund LABD accelerated upward into the close adds weight, we’re potentially at the end of the correction.
The fundamental backdrop continues to implode.
The plan for world control (through speck injected depopulation) is out in the open now. No doubt.
Amandha Vollmer has this update on the decades long, mass hypnosis.
Note: Posts on this site are for education purposes only. They provide one firm’s insight on the markets. Not investment advice. See additional disclaimer here.
Above is the hourly SPBIO chart; inverted and annotated.
Under the conditions shown above, when price action penetrates support and then reverses, it’s called a Wyckoff ‘spring’.
From this point, the expectation is for a moderate rise, then test and then a dynamic rise to the top of the trading range.
Note: Posts on this site are for education purposes only. They provide one firm’s insight on the markets. Not investment advice. See additional disclaimer here.
Then, way back to “Reminiscences“, published in 1923.
As a reminder, we’re looking at biotech (SPBIO) from the perspective of being short the market.
The primary vehicle for that short, is highly leveraged inverse fund, LABD.
The last update gave a hint at the desired timeframe.
If the markets are in the process of reversing, ultimately going to the long awaited (since 2009), final draw-down (i.e. crash), then a likely bottom would occur where they (almost) always occur; during the third week of October.
In a nutshell, that’s the time frame.
Conversely, price action is the final arbiter. If biotech winds up effectively saying ‘not now’, well then, it has the final say.
Back to ‘Entries & Exits’.
One of the traders highlighted in the book (in addition to Weis), was William Doane; former Head Technician for Fidelity.
His timeframe is much longer than the typical market participant. He, like Weis are looking at monthly, quarterly and yearly charts.
That fact in and of itself, provides an edge.
One of the main take-aways from his section was (paraphrasing):
‘The first correction is the hardest. If you can get through that, it’s typically smooth sailing from then on’.
The biotech short via LABD (not advice, not a recommendation) may be at that point now. Painful to watch but necessary.
Next, we go to ‘Reminiscences’.
Those who have read the book, know all about ‘Turkey’; Mr. Partridge.
As the book states, he was much older than the rest who frequented the brokerage. Also, he did not appear to be that active in the markets (thus minimizing his transactions). He was interested in the big move.
The admonition from Partridge, was: ‘Don’t lose your position’. Don’t exit out, expecting a pull-back … that ultimately never comes.
So, we have two examples; three if you include Weis that begin from the very long time-frames and work inward.
Now, on to the market:
The long term, Quarterly analysis has already been done; linked here.
The chart in the link, is from last quarter and since then, (during this quarter), we’ve made new lows.
On the fundamental side, evidence is building by the day on what the ‘speck’ protection is all about.
If you’re really interested in the big picture, here’s a link to a five-plus hour presentation that spells it all out.
Momentum indicators MACD, on the Monthly and Weekly remain in a downtrend.
Using IBB, as the proxy for Quarterly momentum (not enough data for SPBIO), the indicator is flat.
Momentum’s in favor of (maintaining) a short position; not advice, not a recommendation.
The monthly chart of SPBIO (inverted), has price action coming back to former resistance (now support). This is normal market behavior.
Recall, that on the downside, if there is some kind of ‘event’, markets can slice through apparent support levels with ease.
With that in mind, on the inverted chart above, the next major ‘resistance’ level may or may not be of consequence.
Summary:
Each trading week is important.
However, next week will likely a pivotal one; providing more information on whether to maintain short or exit and stand aside; not advice, not a recommendation.
Stay Tuned
Note: Posts on this site are for education purposes only. They provide one firm’s insight on the markets. Not investment advice. See additional disclaimer here.
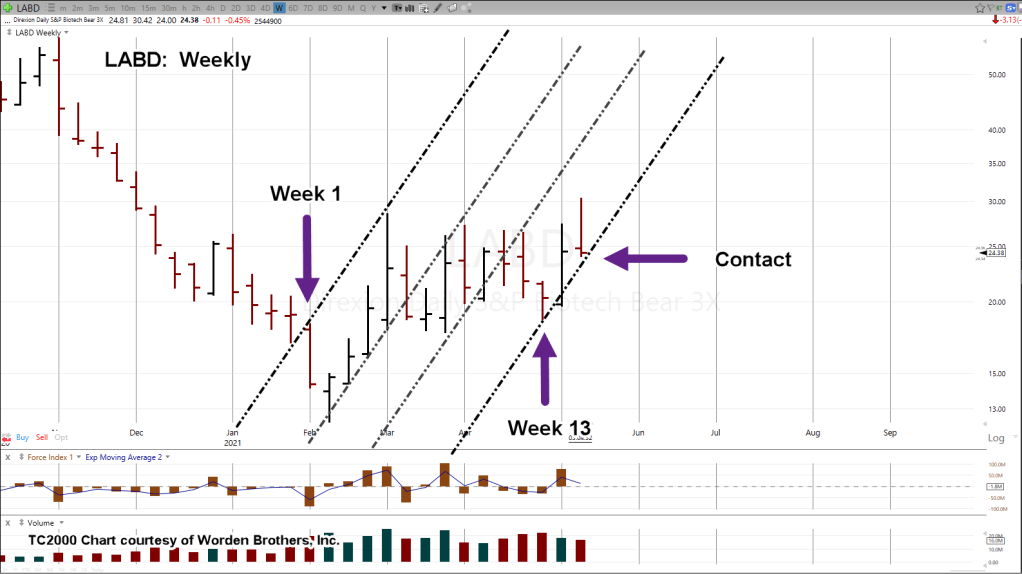
We’ve pulled out to the weekly time-frame on inverse fund LABD.
The chart’s been annotated with the same repeating trend line concept but with adjustments.
It may seem like an obvious statement but to form a trendline, price action needs to contact that trendline.
The internal lines (slightly lighter shade) show the repeating contact of price action … both on the left side of the lines and the right.
The left-most trend has three contacts. One on the left side before the down arrow and the others on the right.
The right-most trend starts at the low (Week 13) and has a potential push out of trend that returns … which may be in the process of confirmation this week.
This trade is currently being managed (not advice, not a recommendation) with an eye on a potential exit in the fall; possibly October – November time-frame.
Note: Posts on this site are for education purposes only. They provide one firm’s insight on the markets. Not investment advice. See additional disclaimer here.
The last update said if biotech SPBIO, made a new daily high, the bulls would be gaining a foothold.
That new high and the foothold, have come and gone.
Admittedly, the retrace in SPBIO and inverse LABD went farther than anticipated.
However, as of this morning’s action, the attempt to move higher in biotech has either failed outright, or has been severely damaged.
If it’s failure, then we’re set up for a major downside move.
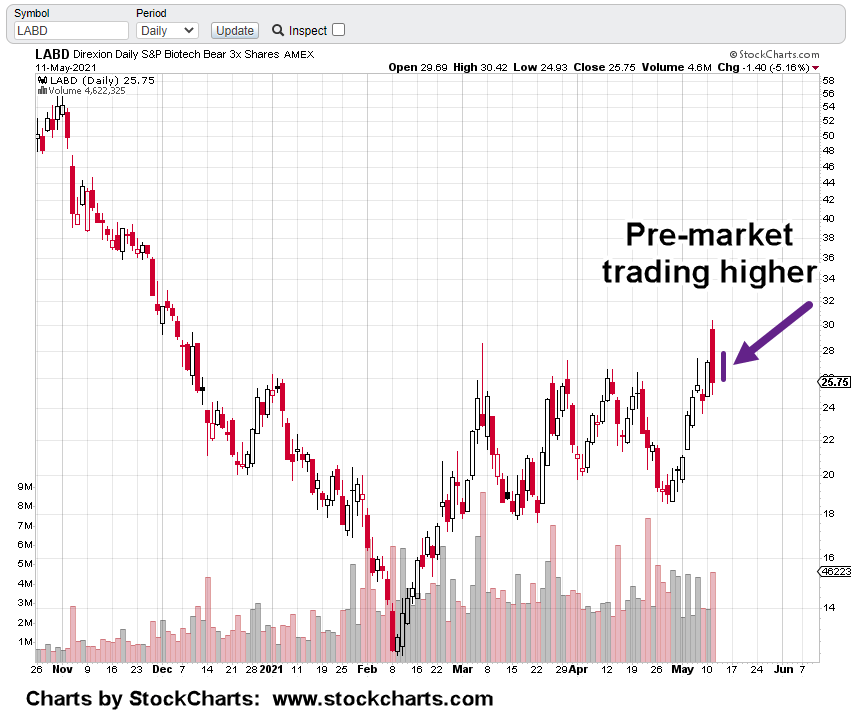
The daily chart of inverse LABD, has the now familiar trend-lines that are a repeating pattern.
The last two days may have formed yet another right side trend; rising at the same angle as the others on the chart.
There’s a remote chance, as price action nears SPBIO support (LABD near 30), the bulls could once again attempt to reverse course.
With the overall market oscillating to the downside (today’s counter move notwithstanding) and with biotech in the downside lead, an upside move seems unlikely.
Note: Posts on this site are for education purposes only. They provide one firm’s insight on the markets. Not investment advice. See additional disclaimer here.
Note: Posts on this site are for education purposes only. They provide one firm’s insight on the markets. Not investment advice. See additional disclaimer here.
If the UUP dollar index ETF, manages to push below the 24.00 – level, it presents the opportunity for a significant bullish divergence.
As Van Metre has stated many times over the past few months, the market’s not expecting, and not in position for a dollar rally.
How can it be … with the rabid gold bulls thrashing about with each upward blip in GLD, GDX and GDXJ.
From this site’s perspective, we’re staying away from that (gold) market and have focused on biotech … where things are really getting underway; but now, back to the dollar.
The weekly chart of UUP, shows the potential set-up.
If somehow we get a (narrow range) push below the 24-level, it would set up a clear bullish divergence on the MACD.
At this point, anything can happen.
Saying that gold will crash if the dollar launches upward is certainly possible. However, in today’s world, the opposite could happen as well.
Just one more reason to say away and focus on shorting an index that’s decisively moving lower: Biotech (not advice, not a recommendation).
Side Note:
The whole ‘divorce’ thing, you know what I’m talking about, could be a signal in disguise.
The ‘higher ups’ may have decided our cardigan wearing benefactor has reached the end of usefulness.
If so, how many biotech rats are now going to jump ship (before the paddy wagon arrives) knowing the jig is up?
Could that be why SPBIO, posted new lows in five time-frames; Daily, Weekly, Monthly, Quarterly and Yearly, last week?
Note: Posts on this site are for education purposes only. They provide one firm’s insight on the markets. Not investment advice. See additional disclaimer here.
Massive downside potential for biotech SPBIO; upside for inverse, LABD.
Unless there’s some kind of unexpected reversal, LABD is showing its colors … huge upside potential.
As expected, LABD has completed its testing action previously discussed in these two updates; here and here.
At the minimum, we’ve got a right side LABD trend that if followed, will result in a doubling of current price near the end of this month or early next.
A trailing stop can be used which adheres to the (now confirmed) trend; not advice, not a recommendation.
If LABD really is in the channel shown, the top of the range even at this point, is around the 170-level; nearly 550%, from current price.
As always, anything can happen. For now, we’re sitting tight and letting price action dictate the next trading move.
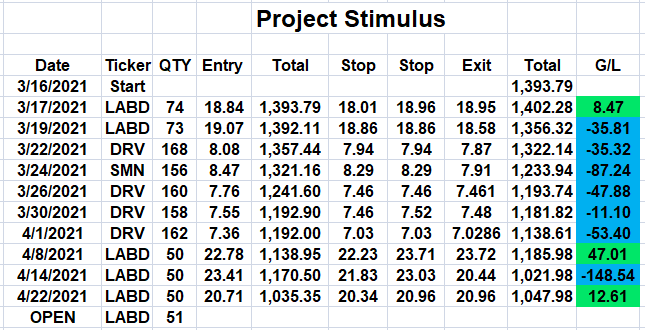
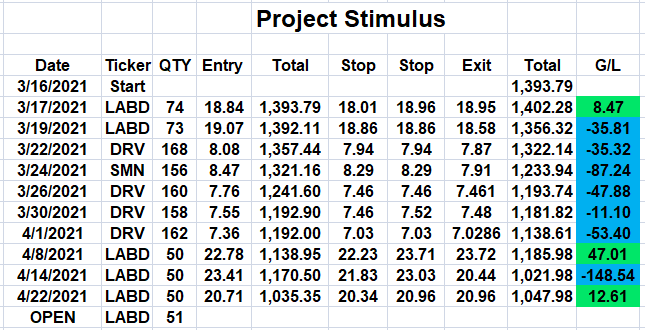
The Project Stimulus account will need to get above the $2,000 level before margin is allowed (by the broker).
By that time, it may be a moot point; volatility could be too high for any kind of size increase.
Note: Posts on this site are for education purposes only. They provide one firm’s insight on the markets. Not investment advice. See additional disclaimer here.
While the markets grab headlines of all time highs, biotech’s at the crossroads of collapse.
This site has zeroed in on the most likely candidate to head decisively lower once the bubble has burst.
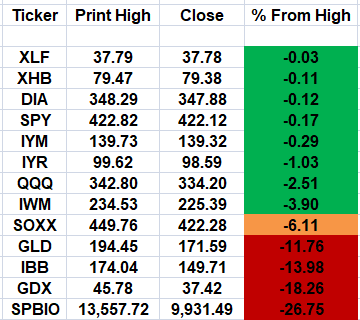
In fact, if we look at the table of tracked markets below, biotech’s SPBIO, has taken over downside leadership.
Next to last is GDX; the senior mining index.
Repeated many times before, this sector is overcrowded with delusion on both sides. From a trading standpoint, no thank you.
Daily and monthly charts of biotech SPBIO are below. Both charts are inverted and have Fibonacci projections.
The charts are essentially clean so they don’t clutter the data.
Daily SPBIO (inverted):
Monthly SPBIO (inverted):
If SPBIO gets to the extreme Fibonacci projection of 261.8%, it will represent a sector decline of just over -92%.
Sounds about right; not advice, not a recommendation.
Recall, from the 1929 highs to the lows in 1932, was around -84% (depending on the source).
Under those extreme circumstances, -92% decline is not unreasonable.
Of course, if a collapse does happen, it’s not likely to go straight down. The entire ’29 crash did not go straight down either. There were many false rallies on the trip to the bottom.
Note: Posts on this site are for education purposes only. They provide one firm’s insight on the markets. Not investment advice. See additional disclaimer here.













 The Danger Point®