Monthly, weekly and daily MACD histogram, all down.
We’ll look at several daily charts before moving on to weekly and P&F.
Above, the Head & Shoulders pattern is clear. There’s a down-sloping neckline with a rally that looks to be rolling over.
An alternate view are two wedge patterns:
On to the weekly. A Fibonacci projection has been added showing down move potential.
Lastly, daily P&F with its own projections.
Interesting to note: Range from 104 – 127, closely matches the 100.0% – 161.8%, Fibonacci range of 108.50 – 128:
From the previous update, biotech IBB, appears to have broken from the crowd. Momentum indicators on multiple timeframes have all lined up to the downside.
Friday’s after-market activity (BigCharts), has IBB down -0.84, on a solid 1,035,712, shares.
If the aftermarket volume is correct (no misprints or errors), it’s equivalent to 25% , of the entire volume for the day’s regular session.
Stay Tuned
Note: Posts on this site are for education purposes only. They provide one firm’s insight on the markets. Not investment advice. See additional disclaimer here.
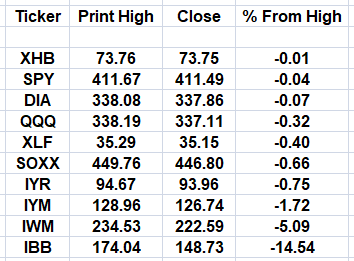
The table lists well known index ETF’s; along with most recent highs and current (Friday) close:
All the usual suspects are there:
S&P 500, SPY, The Dow 30, DIA, Nasdaq, QQQ, and on.
What’s also listed is how far each index (ETF) is from its most recent all time high or ‘recovery’ high (in percentage terms).
Obviously, one of these is completely out of bed: Biotech, IBB
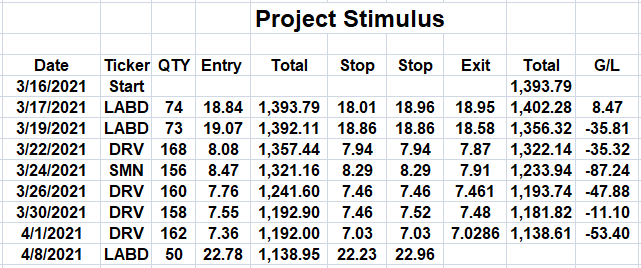
We’ll be discussing the technical condition of biotech tomorrow. For now, the updated ‘project’ chart’s included below:
Note: Posts on this site are for education purposes only. They provide one firm’s insight on the markets. Not investment advice. See additional disclaimer here.
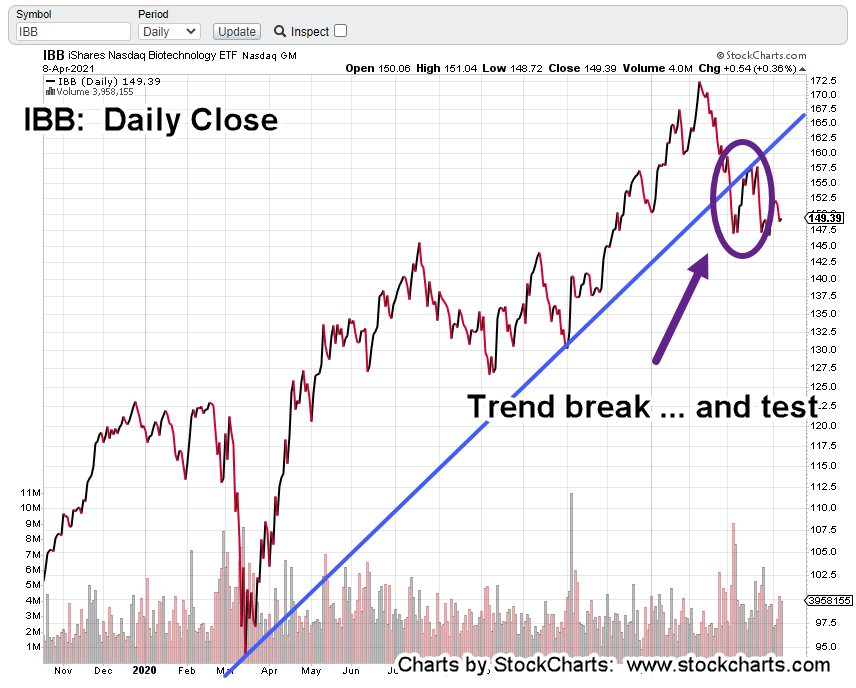
Decisive trend break and test. Biotech IBB’s, ready to continue downside action.
Today may be the day for downside follow-through. We’ll see.
The work has already been done showing long term IBB, has reversed to the downside. Reference posts here and here, if needed.
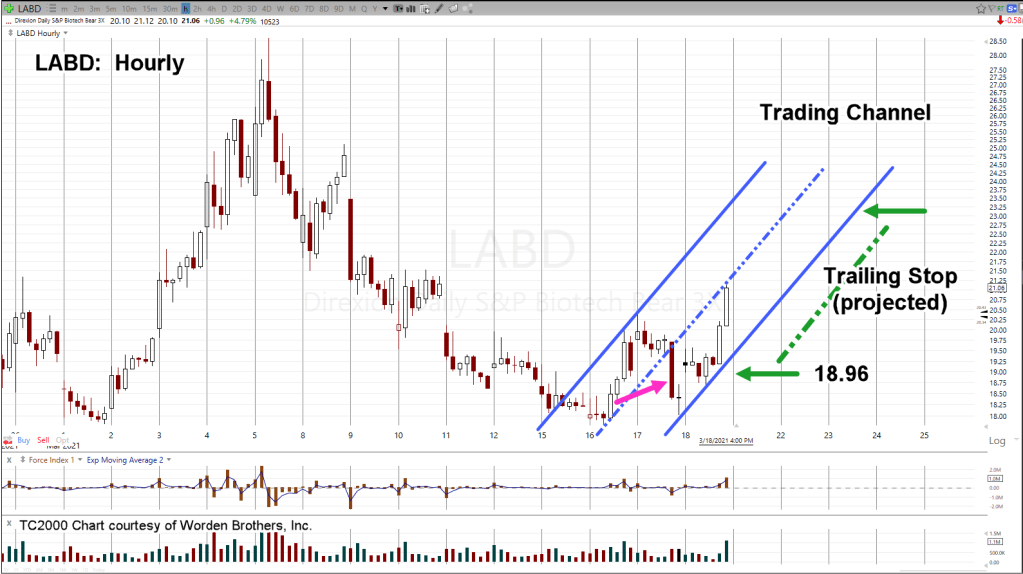
The hourly chart of inverse fund LABD (3X inverse, IBB) shows pre-market range along with potential trend activity.
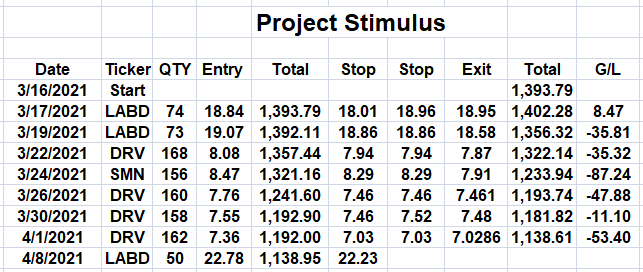
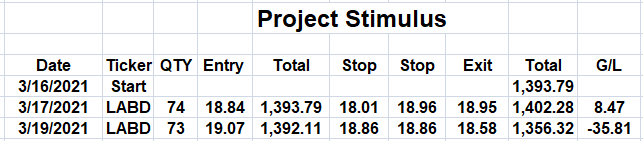
Yesterday, IBB was shorted via LABD (not advice, not a recommendation). Project table below:
If and when IBB makes a new daily low and LABD a new daily high, the stop will be moved. If so, the GTC stop order is likely to be updated toward the end of the session.
As this post is being created, Bid/Ask spreads on LABD are fluctuating.
Last trade @ 23.31 +0.23, +1.00%. Earlier, pre-market trading was lower.
Note: Posts on this site are for education purposes only. They provide one firm’s insight on the markets. Not investment advice. See additional disclaimer here.
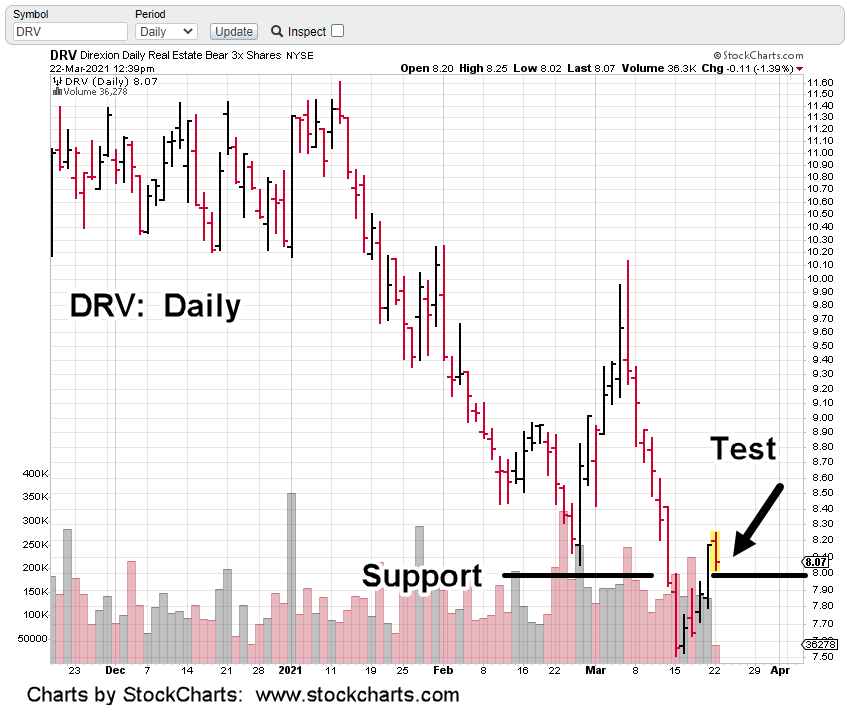
DRV pushed through our stop early in the session; position closed (not advice, not a recommendation).
1:50 p.m. EST:
Despite all the analysis, IYR is showing continued buoyancy.
Something else is going on; possibly related to Uneducated Economist’s link provided in the last update.
Taking his cue, a functioning mortgage market is all important to the financial narrative, it’s possible this market will be more heavily manipulated than others.
At this juncture it would make sense. All indications are for reversal … yet it’s not happening in any significant way.
Time for another trade.
We’re going back to a market that in retrospect, should’ve been the focus all along; Biotech.
This site’s coming from the perspective those reading, are well aware the ‘speck’ as we call it (to avoid censorship) was a fabricated event.
Just a reminder that we’re not some ‘Johnny come lately’, here’s the link from way back in May, last year.
That post proves the situation was figured out well before the May 17th publish date (interviews, observations conducted a month prior).
What’s not fabricated however, are the repercussions from the so-called cure for the speck.
Unfortunately, those are happening now and are quite real.
Moving on to the trade.
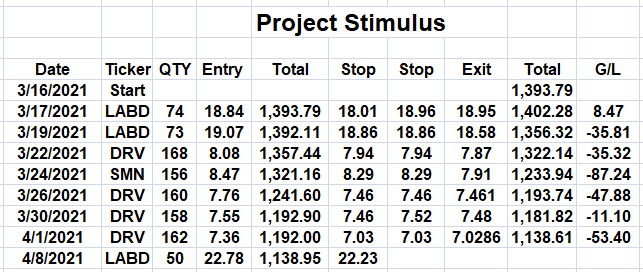
Despite the number of transactions shown in the Project Stimulus table (below), the objective is to minimize activity. We’re looking for a mid, to long term sustainable move; gain potential, 100% to 1,000%.
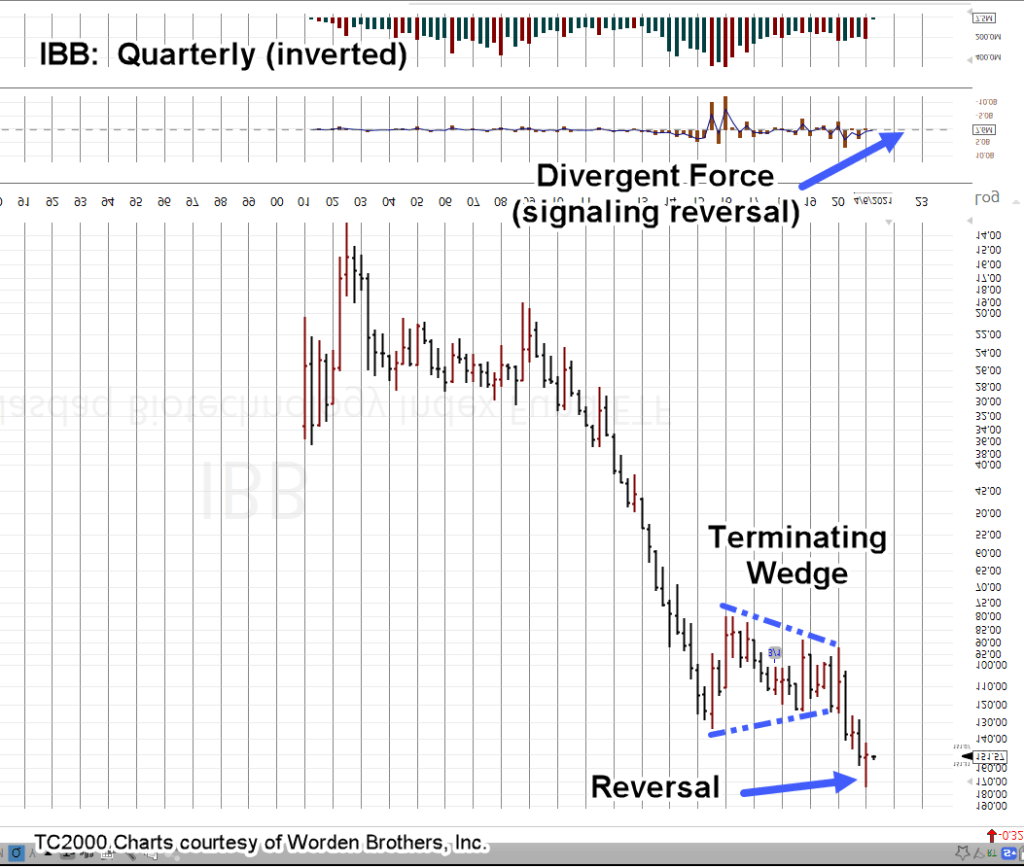
Monthly and weekly have reversed as well; both the monthly and weekly MACD indicators point down. Daily is essentially flat.
The hourly chart of LABD (3X inverse IBB) shows the entry location and subsequent price action. Stop is the session low @ 22.23 (not advice, not a recommendation).
It’s worth repeating, the false narrative on the speck and consequences of speck protection may blow up in the media (and biotech) at any time.
As J.P. says, getting people to do something they know is bad for them (or lethal) is the ultimate ‘elite’ high.
Note: Posts on this site are for education purposes only. They provide one firm’s insight on the markets. Not investment advice. See additional disclaimer here.
The inverted chart puts it into perspective. Biotech has already reversed.
It would seem fitting as truth is hard to put down forever.
One can only hope the whole fake ‘speck’ narrative will be blown wide open … taking the entire sector down with it.
It may already be happening but in such slow (long term) motion that we’re not noticing it.
Note: Posts on this site are for education purposes only. They provide one firm’s insight on the markets. Not investment advice. See additional disclaimer here.
Yesterday’s swift move lower in IBB looks like the start of the next leg down.
Update 10:34 a.m. EST in red below:
Closer inspection however, shows biotech could pivot and move to higher levels … if only temporarily.
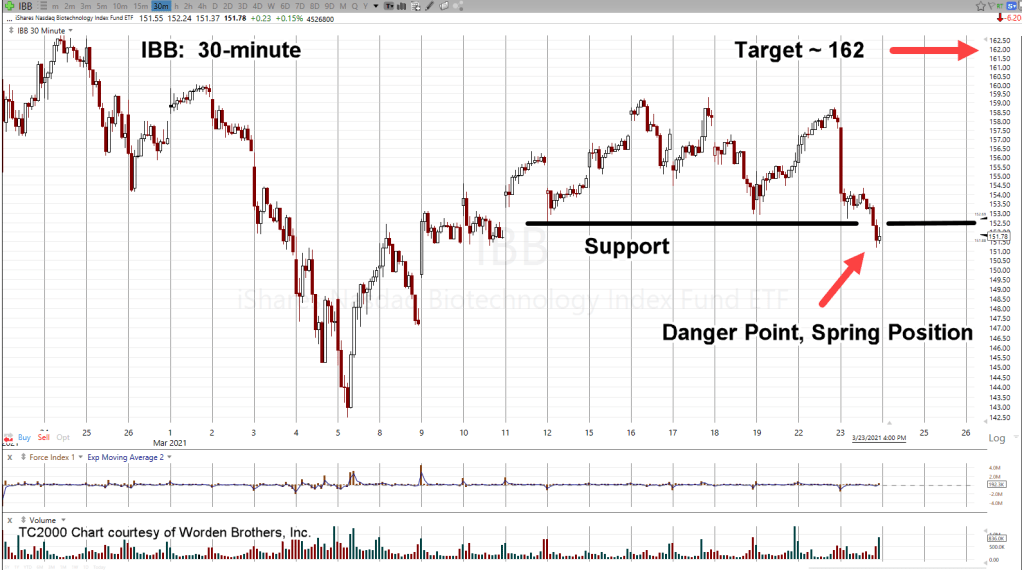
We’re looking at the 30-minute chart of IBB. Yesterday’s action penetrated minor support and stopped dead.
When price action behaves in that manner, it puts the index in what Wyckoff called ‘spring position’ ready to move higher.
Then we have the wide 30-minute (red) bar from the session; likely to be tested. To do that, action needs to move higher.
The target area is near a 62% retrace of the entire down move from the high on February 10th, to the low on March 5th.
Note, yesterday was a Fibonacci Day 13, from that March low.
Even though IBB’s likely to move higher, we’re leaving it alone.
If action gets to the target, we’ll be ready to short (via LABD) if there’s opportunity.
Update:
It’s not called “The Danger Point” for nothing.
Price action penetrates deep below (minor) support effectively negating the ‘spring’ scenario discussed.
We’ve now penetrated below another support level
Price action can still spring upward from here … although probabilities appear to be fading.
Either way, we’re not interested in going long at historic valuations.
Separately, our ‘project’ has maintained short real estate via DRV (not advice not a recommendation), to be covered in a later update.
Stay Tuned
Note: Posts on this site are for education purposes only. They provide one firm’s insight on the markets. Not investment advice. See additional disclaimer here.
Note: Posts on this site are for education purposes only. They provide one firm’s insight on the markets. Not investment advice. See additional disclaimer here.
There’s been a change in direction; a sentiment shift.
Not in any particular order:
The Fed will not, or does not want to control the long end of the curve (long bond).
Interest rates (mortgage rates) are now rising and have been there long enough to start affecting the real estate market.
As reported by Uneducated Economist, there’s been a shift in behavior of his lumber customers.
Instead of furiously attempting to secure lumber (as prices continue to rise), now, there’re backing off; Not wanting to be holding overpriced inventory if/when there’s a reversal.
Remember:
Sentiment first. Then volume. Then direction
From way across the pond, Bjorn Andreas Bull-Hansen gives his input that ‘Things are changing … the entire structure of society’.
He also sates, as this site has done many times … ‘it’s not coming back’.
Note: Posts on this site are for education purposes only. They provide one firm’s insight on the markets. Not investment advice. See additional disclaimer here.
‘The Market Makers don’t know you are there; they’re not interested in your tiny little stop order.
If your order does get taken out, it’s because too many small traders put their stops at the same location.
There’s an order imbalance. The market’s response is essentially automatic … take out the stops.’
While the original LABD 18.96, stop may not have been a popular location for the small (and maybe big) traders, price action throughout the day could have ‘pumped’ the stops to that location.
Case in point is the huge block trade just at the 1:00 p.m. EST, mark.
At that point, 31,500 shares went by (on the tape) at price 19.10 … which equates to over $600,000 in one transaction.
So, where are you going to put your stop for that position. Below the market, right? Maybe at 18.95 let’s say? Especially so ,when price action instantly rallies away from that entry; all the way to 19.78, intra-session.
The stop would appear to be tight but well positioned.
However, if there was a stop for that huge block and it was too close to the market (with other stops accumulating), it would act as a magnet for price action; drawing it back to that level to get the transaction (hit the stop).
Of course, it’s all conjecture and we won’t ever know for sure.
If the LABD market opens significantly higher (IBB lower) on Monday, then our assessment looks correct.
A lower or unchanged open, signals us to get out. If that happens, then IBB is likely to be heading higher.
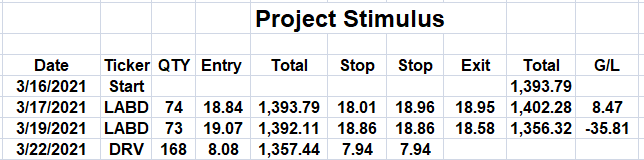
As you may have guessed by now, the response to all this kabuki was to re-position the stopped-out order.
The table below has the summary:
Note: Posts on this site are for education purposes only. They provide one firm’s insight on the markets. Not investment advice. See additional disclaimer here.
The first objective on the newly announced ‘Project Stimulus’, is protect the position.
As yesterday’s announcement stated, we’re taking the stimulus payment and trading a separate account.
The trading techniques to be used are presented on this site.
The magenta bar shows the entry at LABD 18.835 (not advice, not a recommendation) opened during the Fed speech this past Wednesday.
The reason for the entry at that time was two-fold.
First:
Biotech IBB was already at 50% retrace and had rejected that level once.
Monthly and weekly momentum MACD, indicators were (and are) pointing down; giving extra weight to a potential reversal.
Second:
Empirical data (i.e. experience) gathered over a thirty year period had shown, whatever direction the market took during a Fed speech, was quickly reversed in the coming days:
I’ve labeled such events as “Fed-Fake”.
At this point, the position is well in the green, closing at $1,552, yesterday. We’ll be putting in a hard stop at 18.96, shown above.
If we’re in a sustained reversal, it’s not unreasonable to expect price action to get back to previous near-term highs (lows for IBB).
Using highly leveraged LABD (not advice, not a recommendation) that would equate to about a 50% gain.
Stay Tuned
Note: Posts on this site are for education purposes only. They provide one firm’s insight on the markets. Not investment advice. See additional disclaimer here.








 The Danger Point®