Is a long-term, downside reversal in this sector, about to bubble to the surface?
With yesterday’s update, it’s easy to get lost in the hourly and daily maneuvers; see a likely (short-term) potential, while it just distracts from the bigger picture.
That ‘big picture’, is below.
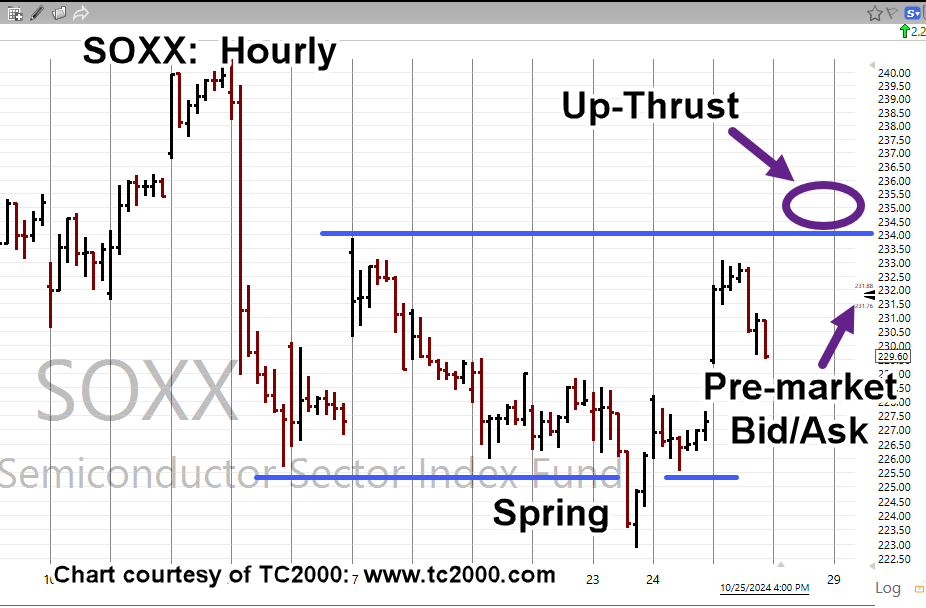
Once again, we have a (potential) repeating set-up: Wyckoff ‘Spring-to-Up-Thrust.
Biotech XBI, Weekly Close
With this week’s volatile action but lower overall close (from last week), the ‘up-thrust test may be complete (not advice, not a recommendation).
Note: Posts on this site are for education purposes only. They provide one firm’s insight on the markets. Not investment advice. See additional disclaimer here.
Note: Posts on this site are for education purposes only. They provide one firm’s insight on the markets. Not investment advice. See additional disclaimer here.
Note: Posts on this site are for education purposes only. They provide one firm’s insight on the markets. Not investment advice. See additional disclaimer here.
The next trade (lower) could be in silver itself, or it could be in the Junior Miners, GDXJ, and/or SILJ, the sectors (ETFs) most susceptible (not advice, not a recommendation).
The last time silver had a major downswing was in early-to-late 2022; tracking fund SLV, declined about -35%, top-to-bottom.
During the same period, Junior Miners GDXJ, declined over -50%, so take your pick.
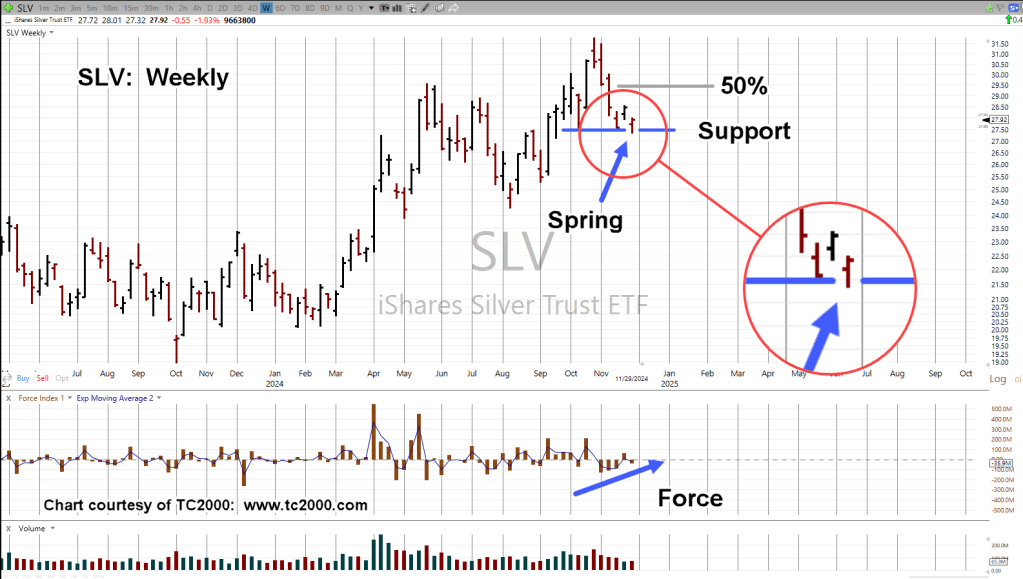
Silver SLV, closed out last week penetrating downside support and then moving (inching) back higher.
We should all know what that means. 🙂
Silver SLV, Weekly
Silver penetrates support and then retraces; Wyckoff ‘spring’ position (not advice, not a recommendation).
The 50% retrace area is shown. It will be interesting to see if SLV, gets that far.
Perhaps more interesting from a set-up standpoint, is what GDXJ, and SILJ, will be doing if and when that happens.
Positioning: SLV & Miners
The mining sector has been ‘out-of-favor’ since this update years ago.
Since that time and looking at the charts, the most dynamic (fastest action) trade opportunities, were to the downside.
There are no open positions in this sector at this time (not advice, not a recommendation).
Positioning: Biotech, XBI-24-01
Separately, as stated in this update, the short trade in biotech (via XBI) was brief.
It was stopped out with a loss of 0.15-pts (not advice, not a recommendation).
Note: Posts on this site are for education purposes only. They provide one firm’s insight on the markets. Not investment advice. See additional disclaimer here.
Strange things happen in the markets just before, during, or just after a holiday week.
This time is no different.
With all that’s gone on in the past few weeks, one gets a sense ‘the jig is up’.
One example of the curtain being pulled back on a well-established grift, is this unrelated, but related post, link here.
So, it could be with biotech.
The past two weeks look like a change of character (not advice, not a recommendation).
Biotech XBI, Daily
It’s been a Fibonacci 13-Days since the reversal on 11/11.
The sector has accelerated to the downside on record volume and now, is testing that break.
The ‘Axis Line’, is also the location of the 61.8%, retrace for the current down-move and test.
Although there’s been no new daily low to ‘confirm’ the test is complete, (upside) risk may be at a low.
Positioning
For reasons to be covered in a later update, this sector’s being shorted directly as opposed to using leveraged inverse LABD (not advice, not a recommendation).
Trade is labeled: XBI-24-01
Stop level for the short is (or will be) the session high, currently at XBI 99.79 (not advice, not a recommendation).
Note: Posts on this site are for education purposes only. They provide one firm’s insight on the markets. Not investment advice. See additional disclaimer here.
It’s literally been years of planning and waiting, for biotech to (finally) be exposed.
Going way back (over four years) in a cutting, but accurate post on the differences between followers and leaders, was this.
So, is now the time to short?
Is it already too late?
The chart itself will give clues to a possible answer.
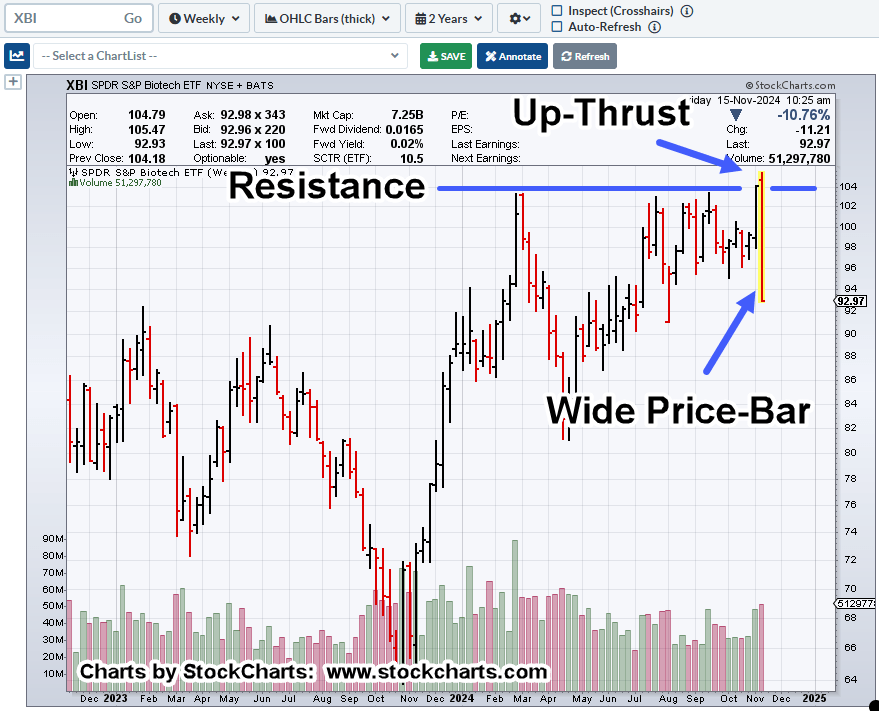
Biotech XBI, Weekly
Those familiar with (typical) market action know, after it’s all said and done, there is a possibility the wide price bar will be tested (retraced by some amount).
At some point, the XBI is likely to find (temporary) support.
When it does, we’ll have some indication of retrace/testing potential (not advice, not a recommendation).
Note: Posts on this site are for education purposes only. They provide one firm’s insight on the markets. Not investment advice. See additional disclaimer here.
One by one, each sector appears to be topping or reversing.
This time, it’s biotech.
Analysis (and action) over the past year has been on again, off again and now, appears to be back on again.
However, this time we have (as we’ll see below) a near perfect Fibonacci correlation.
Biotech Sector Index SPBIO, Daily
First, the big picture.
The corrective retrace that started way back in late October, of last year.
Next, we’ll get in closer to show the exactness of the Fibonacci levels.
It hardly ever works out this perfectly, but there it is.
Change Horses?
It’s no secret, the focus of trading action on this site since mid-October, has been to short semiconductors, potentially the largest bubble (A.I.) in world history (not advice, not a recommendation).
However, biotech may get its comeuppance as well with information like this, this and this hitting the mainstream.
The decision to take action or not, remains open (not advice, not a recommendation).
Note: Posts on this site are for education purposes only. They provide one firm’s insight on the markets. Not investment advice. See additional disclaimer here.
Note: Posts on this site are for education purposes only. They provide one firm’s insight on the markets. Not investment advice. See additional disclaimer here.
Moderna, MRNA, is down -88%, from its all-time highs.
Having worked the markets for nearly forty-years, it (typically) goes as follows …
When a stock declines 80% or more, in short order (12-36 months or so), those with absolutely no analysis skills or discipline, who bought-in because everyone else is doing it (making a supposed fortune), have now lost their shirts.
So, they do what they know best, blame somebody else. Let the lawsuits begin.
The whole thing is so much like High School.
Class action is nothing new. What is new this time around, or what could be new, is the ‘discovery’ process.
One has to wonder if (or when) the lawyers are going to come across this piece of ‘discovery’.
Note: Posts on this site are for education purposes only. They provide one firm’s insight on the markets. Not investment advice. See additional disclaimer here.
Biotech XBI, spent the last three months hitting resistance, going nowhere.
That doesn’t mean there weren’t trading opportunities; there were but the big (expected) break to the downside never came … that is, until now, maybe. 🙂
Looking at the weekly chart, it’s completely different from the current, topping, on-going A.I. mania.
Biotech reached its all-time high, years ago.
Biotech XBI, Weekly Close
The sector’s been retracing to Fibonacci 38.2%, since late February, this year.
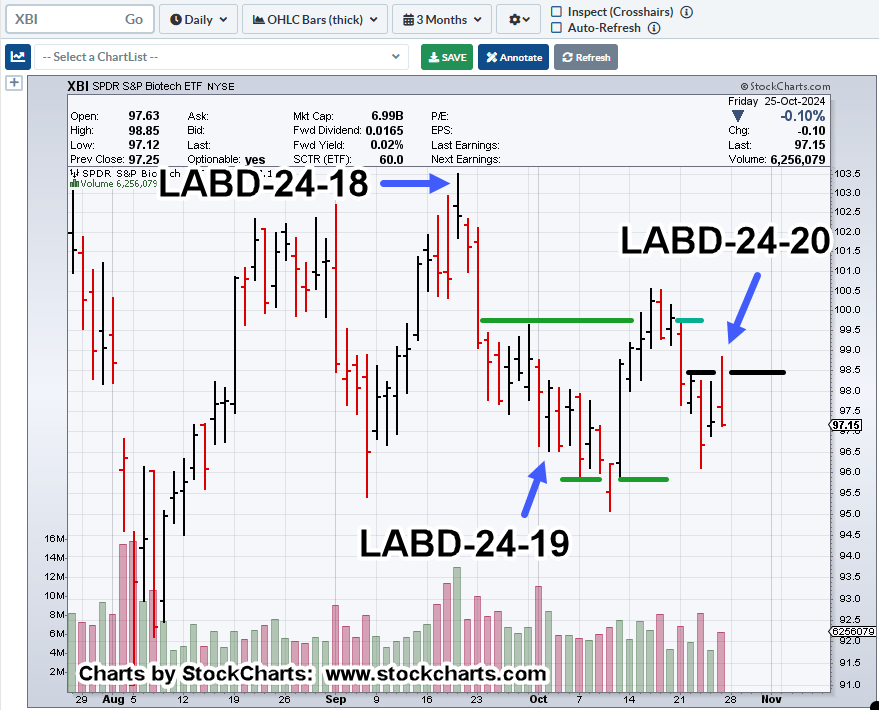
Moving in closer to the daily, the last three (short) trades in the sector are noted (not advice, not a recommendation).
Biotech XBI, Daily
For detail on how and why trades were selected, click on the side bar for that trade number.
Note: We have a repeating pattern (between green lines) of ‘spring-to-up-thrust’.
The Week Ahead
Anything can happen.
With that said, ‘normal’ market behavior would be a ‘blip’ upward to test resistance, the black line.
However, there’s no requirement to do so.
If price action gets above Friday’s high, obviously it’s time to exit (not advice, not a recommendation).
Note: Posts on this site are for education purposes only. They provide one firm’s insight on the markets. Not investment advice. See additional disclaimer here.